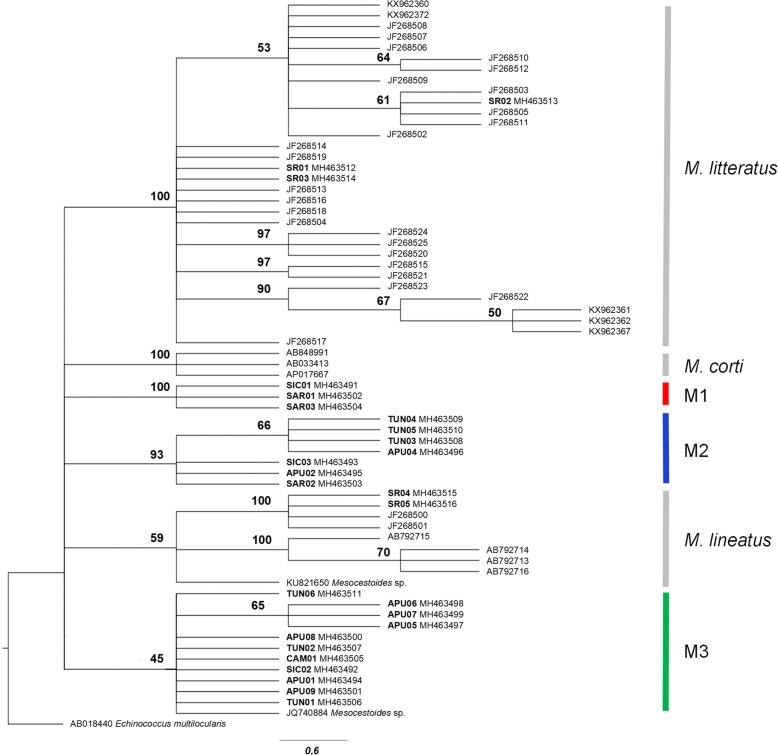
Fig. 4.
Maximum likelihood tree showing the interrelationships among Mesocestoides spp. based on the cox1 dataset. Outgroup: Echinococcus multilocularis. Only bootstrap support values > 45% are shown. The scale-bar indicates the number of substitutions per site. Sample codes are listed in Table 1. M1, M2, and M3 indicate the entities found by species delimitation analysis described in the text

