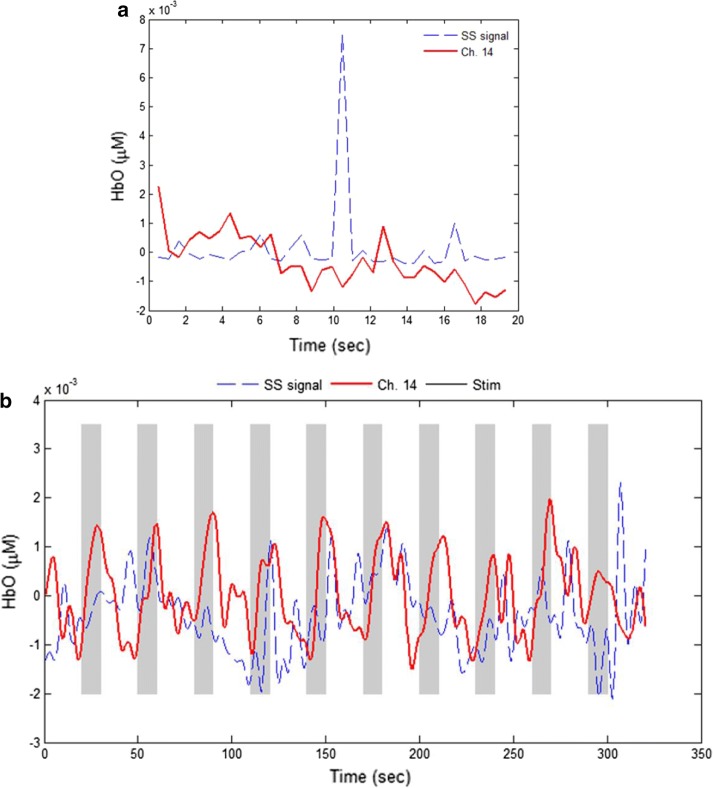
Fig. 5.
Comparison of a SS channel and an active long-separation channel (Sub. 2, Ch. 14 was formed by optodes 4 and 28 in Fig. 3a): a Raw data during the initial 20 s resting period (the peak in blue curve is due to head movement). Correlation (r = − 0.15) of raw short- and active long-separation channel in the 20 s resting state. b Band-pass-filtered signals (cut-off frequencies: 0.01 and 0.15 Hz) of both data for the entire experimental period. Correlation (r = 0.099) of short- and active long-separation channel

