Fig. 8.

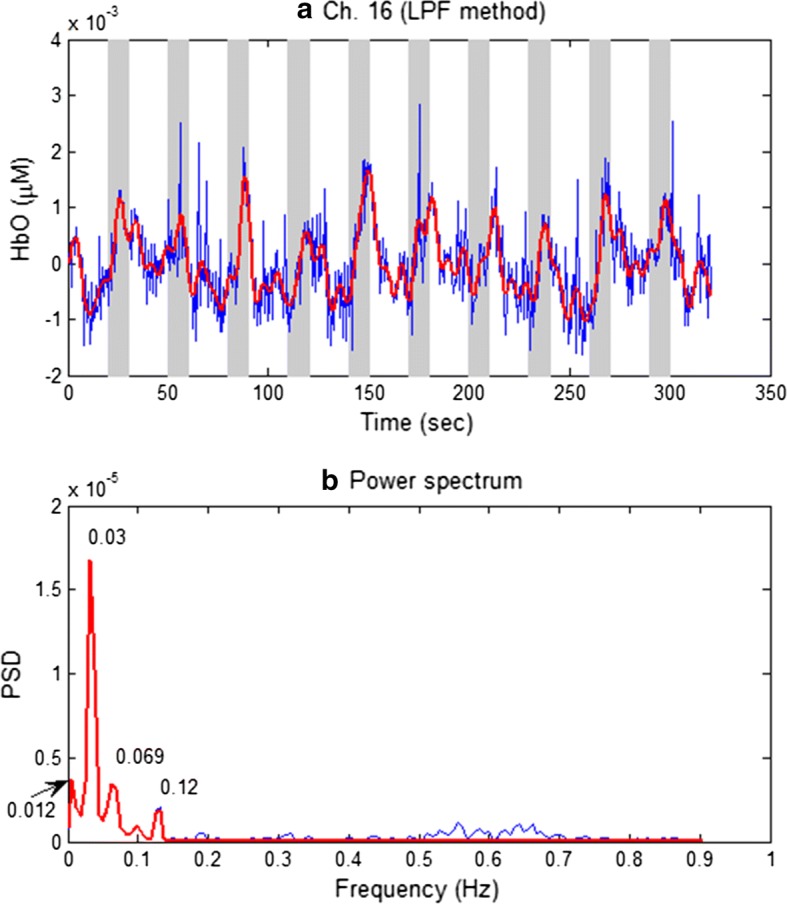
a Raw HbO data (blue curve) relative to the low-passed filtered HbO (thick red curve) with 0.15 Hz cut-off frequency, b the power spectra of a that shows the existence of physiological noises

a Raw HbO data (blue curve) relative to the low-passed filtered HbO (thick red curve) with 0.15 Hz cut-off frequency, b the power spectra of a that shows the existence of physiological noises