
Fig. 3.
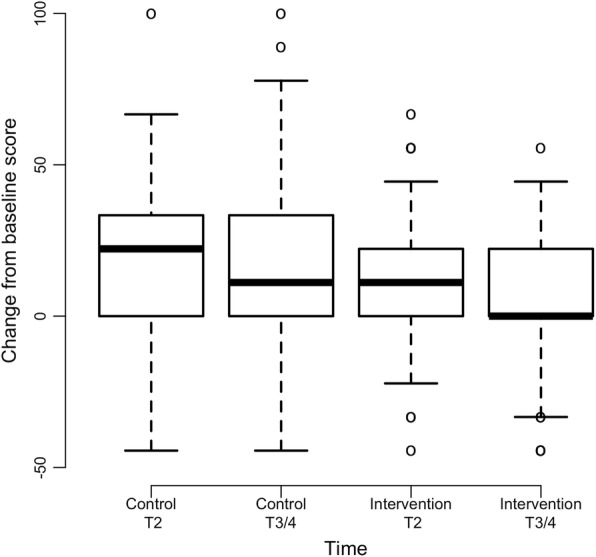
Mean Change in T2 and End of Study (T3/4) Fatigue Scores from Baseline (N = 220). Note: Positive scores represent increased fatigue severity from baseline
Official websites use .gov
A
.gov website belongs to an official
government organization in the United States.
Secure .gov websites use HTTPS
A lock (
) or https:// means you've safely
connected to the .gov website. Share sensitive
information only on official, secure websites.
Mean Change in T2 and End of Study (T3/4) Fatigue Scores from Baseline (N = 220). Note: Positive scores represent increased fatigue severity from baseline