Fig. 4.

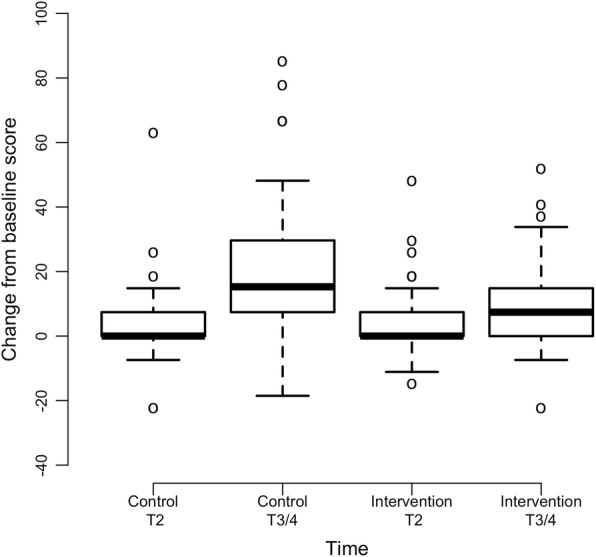
Mean Change in T2 and End of Study (T3/4) Sensory CIPN Scores from Baseline in Participants Receiving High Cumulative Neurotoxic Chemotherapy Dosages (N = 84). Note: Positive scores represent increased sensory CIPN severity from baseline

Mean Change in T2 and End of Study (T3/4) Sensory CIPN Scores from Baseline in Participants Receiving High Cumulative Neurotoxic Chemotherapy Dosages (N = 84). Note: Positive scores represent increased sensory CIPN severity from baseline