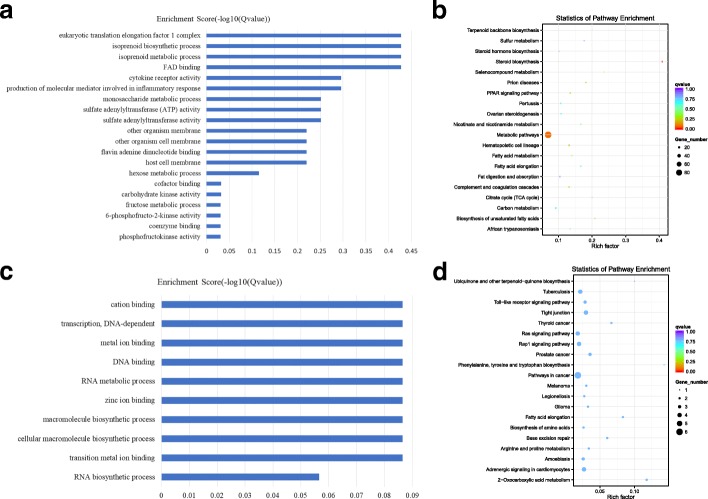
Fig. 5.
The GO and KEGG analysis of co-expressed genes of differential TUCPs. a The GO analysis of related gene of differential expressed and up-regulated TUCPs, X-axis is qValue(−log10), Y-axis is the GO term. b KEGG pathway analyses of up-regulated TUCPs. KEGG enrichment is measured by rich factor, qvalue and the number of genes enriched on this pathway. The larger the Rich factor, the greater the degree of enrichment. The value range of qvalue is [0,1]. The closer it is to zero, the more significant the enrichment is. Pathways with q ≤ 0.05 are defined as pathways that are significantly enriched in differentially expressed genes. c The GO analysis of related gene of down-regulated TUCPs, X-axis is qValue(−log10), Y-axis is the GO term. d KEGG pathway analyses of down-regulated TUCPs. KEGG enrichment is measured by rich factor, qvalue and the number of genes enriched on this pathway. The larger the Rich factor, the greater the degree of enrichment. The value range of qvalue is [0,1]. The closer it is to zero, the more significant the enrichment is. Pathways with q ≤ 0.05 are defined as pathways that are significantly enriched in differentially expressed genes

