
Fig. 2.
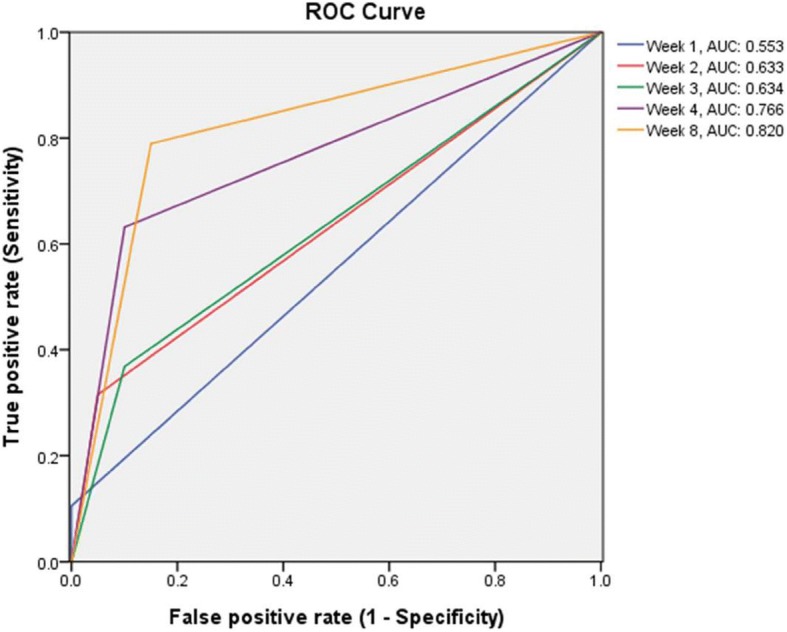
ROC curves of the treatment response at Week 1, Week 2, Week 3, Week 4, and Week 8 for predicting the treatment response at Week 12, when defined as treatment response ⩾25% reduction of the PANSS total score from baseline. AUC: area under the curve; PANSS: Positive and Negative Syndrome Scale; ROC: receiver operating characteristic