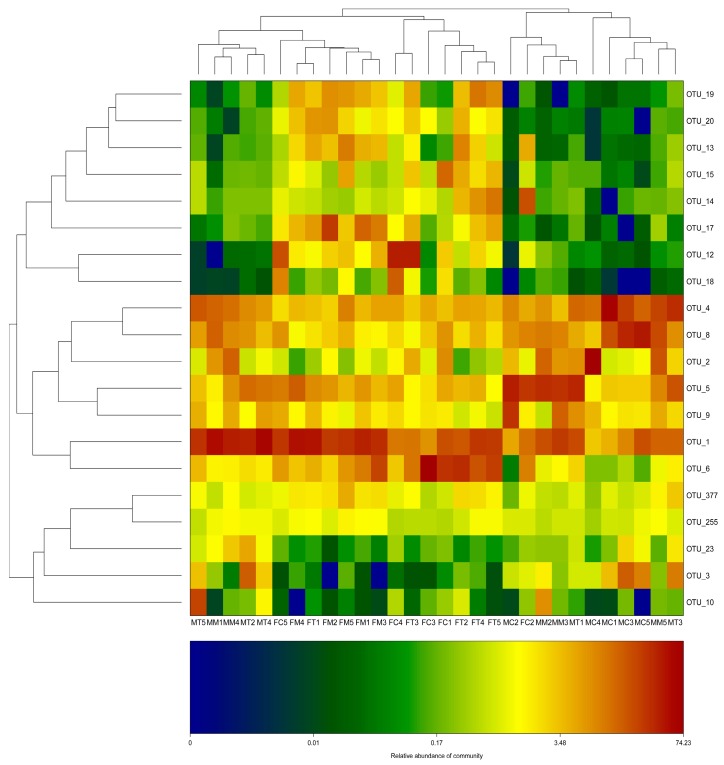
Figure 4.
Distribution of OTUs in intestinal mucosa and fecal samples plotted as a heat map. The data were normalized to proportional abundance and are represented from low (blue) to high (red) for each OTU. OTUs indicate operational taxonomic units. FC, FM, and FT denote the control group, the model group, and the Tiansi-treated group of fecal samples, respectively; MC, MM and MT denote the control group, the model group and the Tiansi-treated group of intestinal mucosa samples, respectively.

