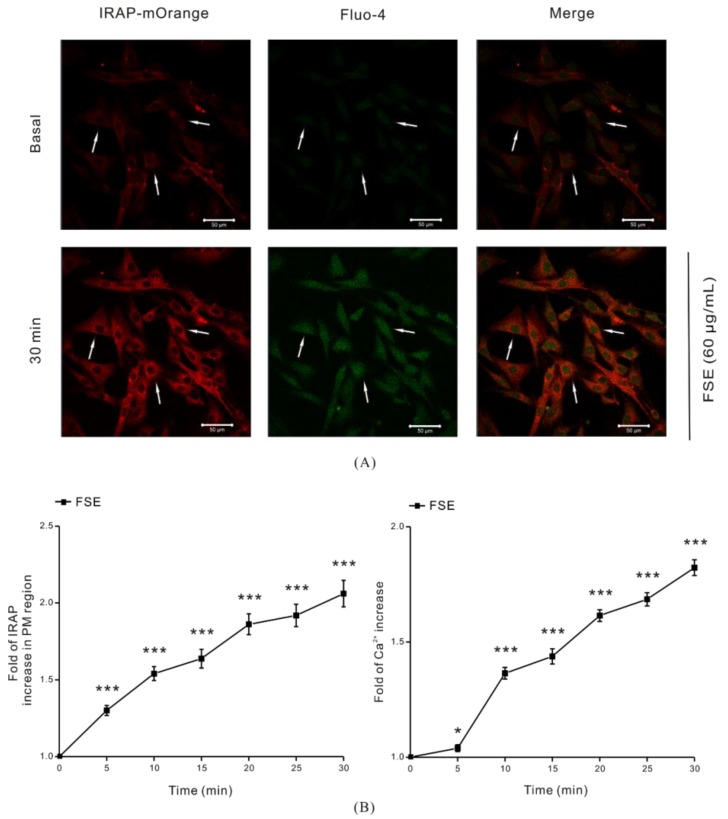
Figure 2.
Stimulating effects of FSE on GLUT4 translocation and intracellular Ca2+ level. The red fluorescence of IRAP-mOrange stably expressed in L6 cells and the green fluorescence of Ca2+ were simultaneously observed by confocal microscope. Scale bar = 50 μm. (A) Intracellular Ca2+ was stained with Flou-4 AM for 20 min, followed by stimulation with 60 μg/mL FSE for 30 min. IRAP-mOrange fluorescence intensity and intracellular Ca2+ fluorescence concentration were detected at excitation wavelengths of 555 nm and 488 nm, respectively, and fluorescence superposition displayed specific positioning. (B) The cell images were recorded over 30 min, and the red fluorescence from the outside edges of cells and the green fluorescence of the whole cells were collected. Fluorescence quantization was done with Zeiss 2010 software. Significance analysis: * p < 0.05; *** p < 0.001.

