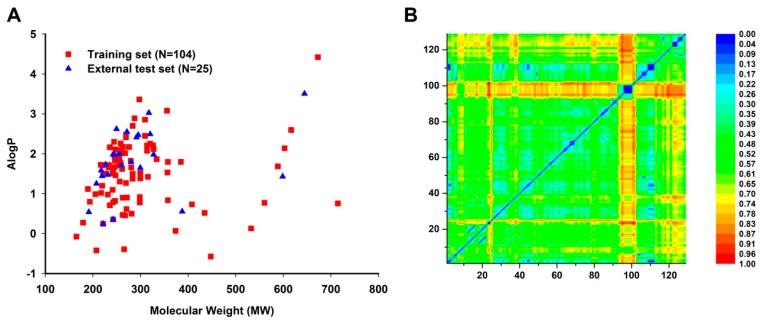
Figure 4.
Chemical diversity distribution of the training set (N = 104 compounds), external test set (N = 25 compounds). (A) Chemical space was analyzed using the molecule weight (MW) and Ghose-Crippen LogKow (ALogP) of each set in the database. N represents the number of compounds in each data set. (B) Heat map of molecular similarity plotted by Euclidian distance metrics for the training and external test sets. Euclidian distance metrics was calculated by MACCS keys fingerprint and processed by normalization.

