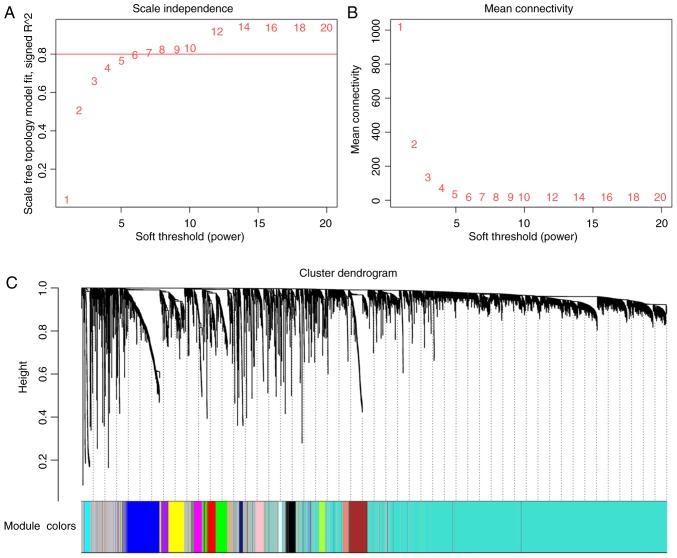
Figure 2.
Analysis of network topology for various soft thresholding powers. (A) The scale-free fit index (y-axis) as a function of the soft thresholding power (x-axis). (B) The mean connectivity (degree, y-axis) as a function of the soft thresholding power (x-axis). (C) Clustering dendrogram of genes, with dissimilarity based on topological overlap, together with assigned module colours.

