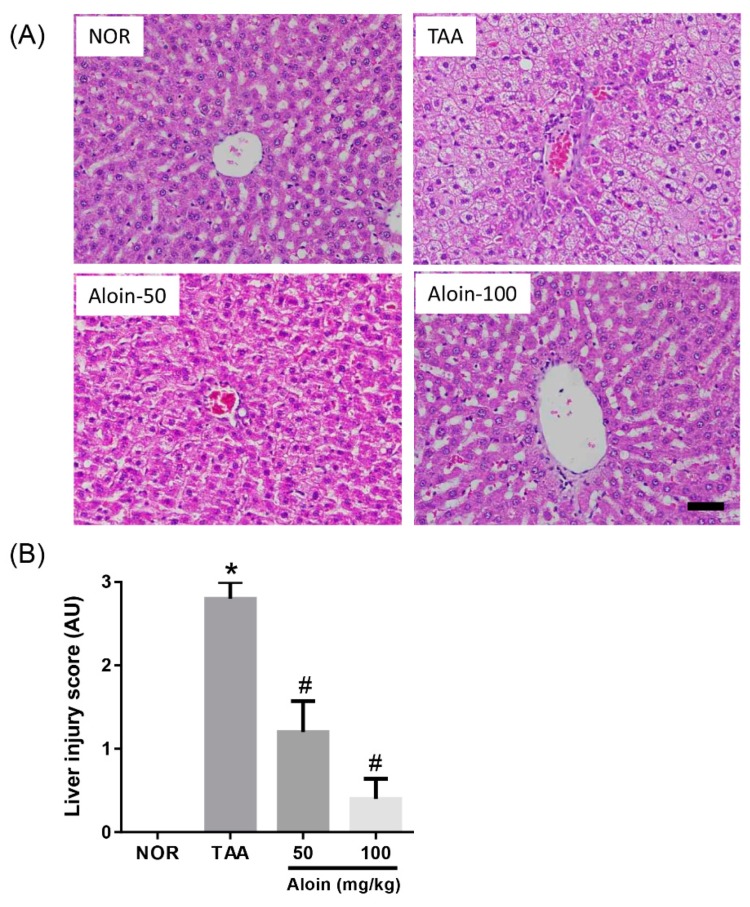
Figure 2.
Effect of aloin on liver injury induced by thioacetamide (TAA). (A) Histopathological changes in the liver. Liver tissue sections were stained with hematoxylin and eosin. Scale bar = 50 µm. (B) Liver injury scores. Values in the bar graphs represent the mean ± SEM, n = 7. * p < 0.05 vs. normal (NOR) control rats, # p < 0.05 vs. TAA-injected rats. AU: arbitrary unit.

