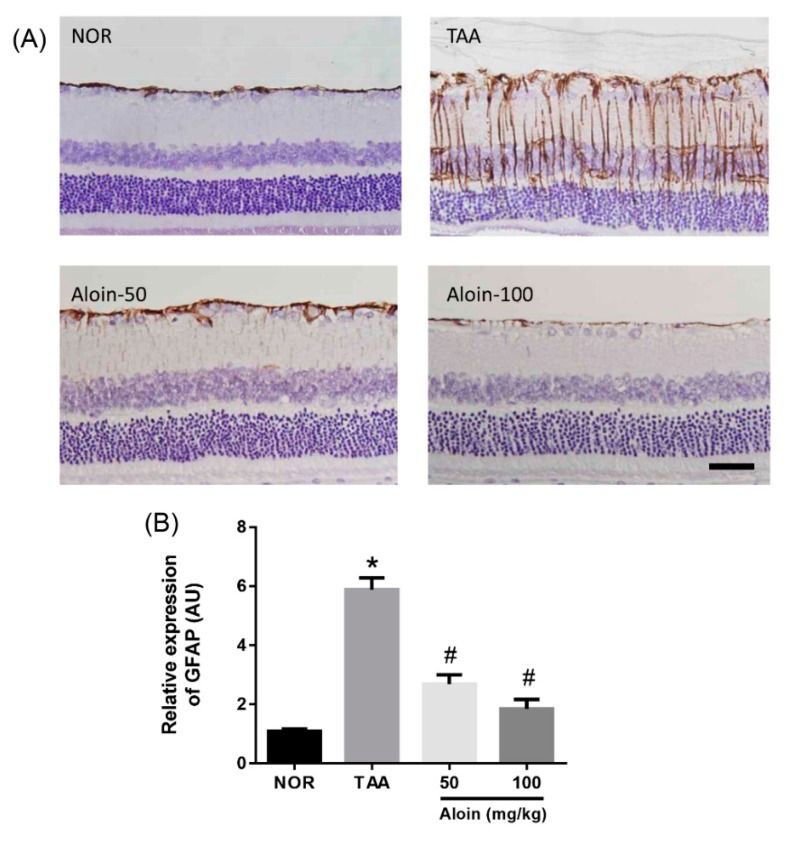
Figure 5.
Effect of aloin on glial fibrillary acidic protein (GFAP) expression. (A) Immunohistochemical staining for GFAP in the retinal tissues sections. Scale bar = 50 µm. (B) Quantitative analysis of signal intensity. Values in the bar graphs represent the mean ± SEM, n = 7. * p < 0.05 vs. normal control rats, # p < 0.05 vs. TAA-injected rats.

