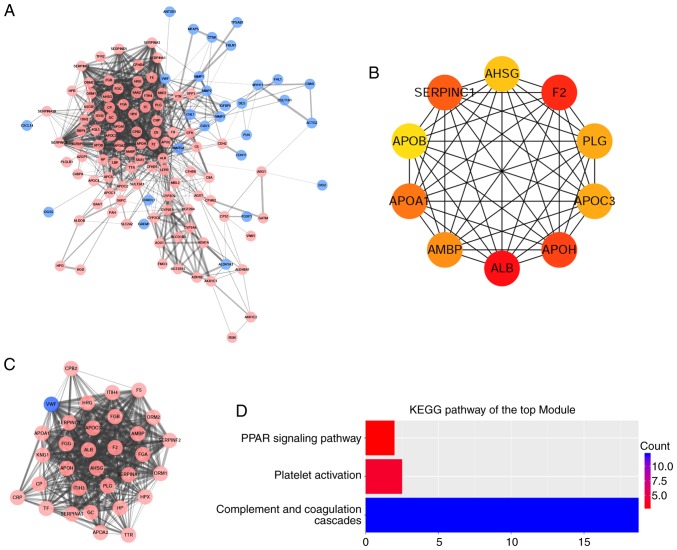
Figure 5.
PPI network and module analysis. (A) PPI network of DEGs. The pink nodes indicated upregulated genes and the blue nodes indicated downregulated genes. The edge thickness was proportional to the combined score of the genes. (B) Top 10 hub genes with a higher degree of connectivity. (C) Top module screened from the PPI network. (D) KEGG pathway enrichment analysis of the top module. PPI, protein-protein interaction; DEGs, differentially expressed genes; KEGG, Kyoto Encyclopedia of Genes and Genomes.

