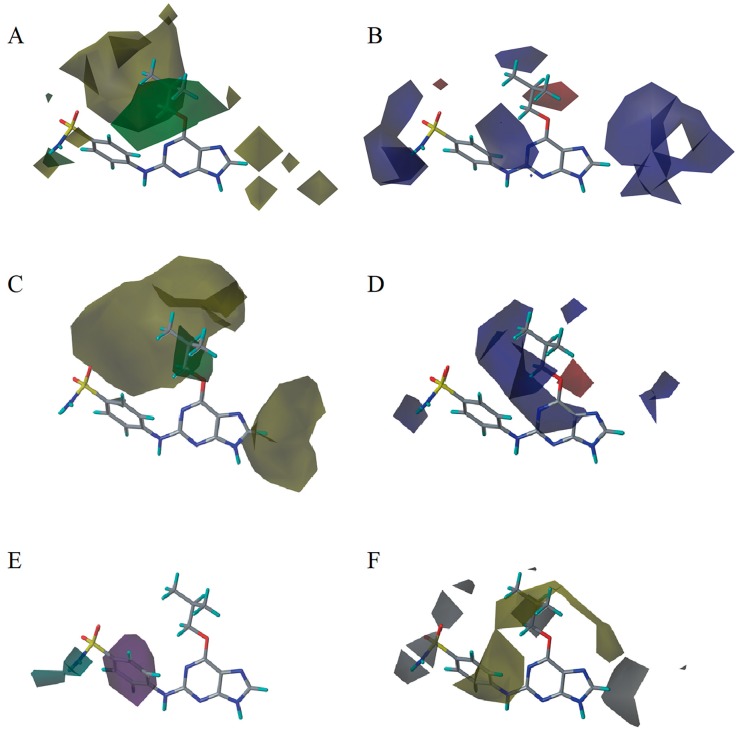
Figure 4.
Contour maps of the optimal CoMFA and CoMSIA models. (A) CoMFA steric contour. (B) CoMFA electrostatic contour. (C) CoMSIA steric contour. (D) CoMSIA electrostatic contour. (E) CoMSIA hydrogen bond donor contour. (F) CoMSIA hydrophobic contour. Steric bulk favored areas that are in green and unfavorable areas in yellow (A,C). Electropositive favored areas are in blue and electronegative favored areas are in red (B,D). The hydrogen bond donor favored areas that are in cyan and unfavorable areas that are in purple (E). Hydrophobic favored areas are in green and unfavorable areas are in white (F).

