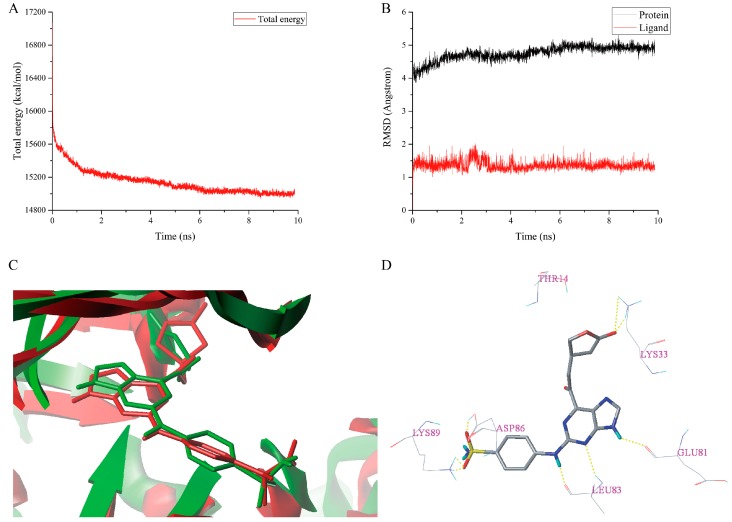
Figure 7.
MD simulations result of the complex 1H1S-I13. (A) The total energy plot. (B) The RMSDs plot. (C) The superimposition of the initial docked structure (red) of complex 1H1S-I13 and the average structure (green) of MD simulation of complex 1H1S-I13. (D) The conformation of I13 after MD simulations. Hydrogen bonds were shown as yellow dashed lines and non-polar hydrogens were removed for clarity.

