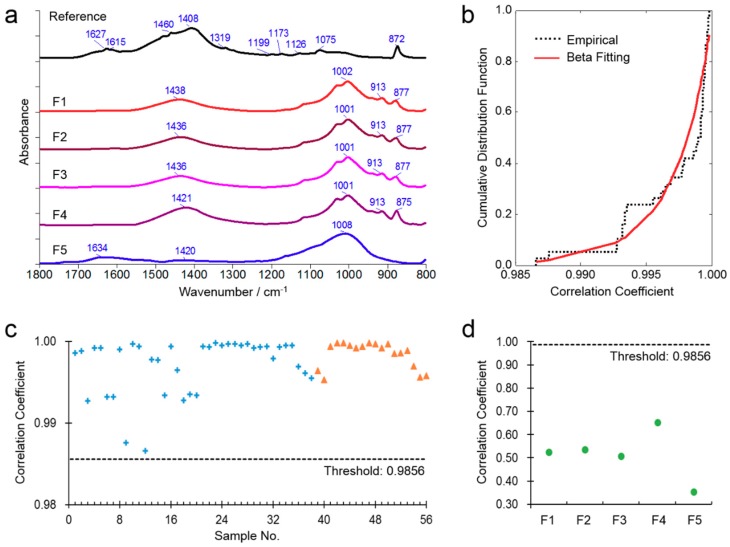
Figure 3.
Correlation-based FTIR identification of Indigo Naturalis. (a) ATR-FTIR spectra of the reference and the fake samples F1–F5; (b) Cumulative distribution of the correlation coefficients of the true samples against the reference; (c) Correlation-based FTIR identification of the calibration true samples (+) and validation true samples (▲); (d) Correlation-based FTIR identification of the fake samples.

