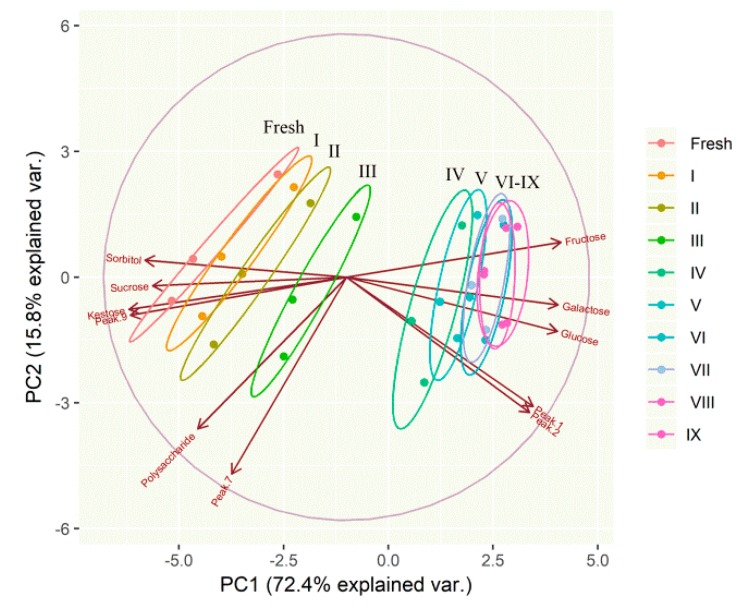
Figure 5.
A biplot showing the samples of fresh and processed rhizomes of P. cyrtonema by different times of repeated steaming on a two-dimensional space derived from principal component analysis basing on identified saccharides and their derivatives; the arrows indicated the projections of the original features onto the principal components; “fresh” means without steam process; roman numerals indicate the number of times of steaming.

