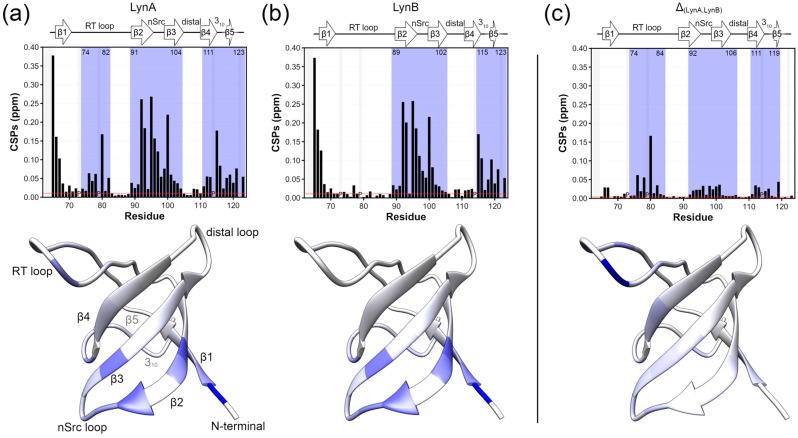
Figure 2.
Interaction between the Lyn SH4-Unique Domains and the SH3 domain; for each panel (top) 1H-15N combined chemical shift perturbations (CSPs) in ppm represented in bar plots. Proline residues are identified with “P”. (bottom) CSP values are mapped on the structure of the Lyn SH3 domain (PDB 1W1F) using a blue scale ranging from 0 (white) to 0.4 (most intense blue) ppm. (a,b) observed CSPs in the SH3 domain within the USH3 constructs with respect to the Lyn USH3 isolated domain for LynA and LynB, respectively. Residue numbers in LynB have been modified to match those of LynA. The blue shade in bar plots represents the continuous regions where perturbations are significant, as defined in materials and methods and based on the threshold represented by the red line. The threshold value is the average plus 5 standard deviations of the 10% lowest CSPs (c) The difference between CSPs values in (a,b). The mapping of the differential CSPs (c, bottom) is in a scale ranging from 0 to 0.15 ppm.

