Figure 5.
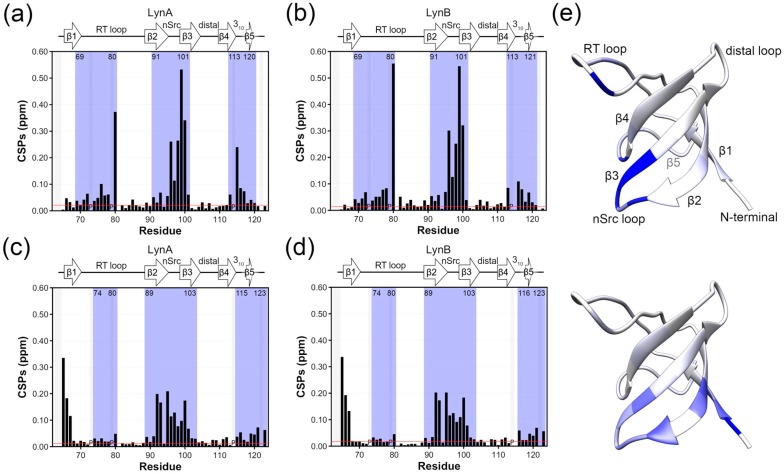
1H-15N combined chemical shift perturbations (CSPs) in the SH3 domain observed: (a,b) before and after the addition of 1 equivalent of VSL12 peptide to (a) LynA (b) LynB USH3 construct; (c,d) between the SH3 domain of LynA and LynB USH3 and the isolated Lyn SH3 domain, both in the presence of 1 equivalent of VSL12 peptide. The blue shade identifies relevant continuous perturbed regions as defined in the text based on the threshold calculated as the average plus 5 standard deviations from the 10% least affected residues. The letter “P” identifies proline residues. (e) CSP values are mapped on the structure of Lyn SH3 (PDB 1W1F) in a blue scale ranging from 0 (white) to 0.3 (intense blue) ppm obtained (top) in panel (a) (bottom) in panel (c). The numbering used for LynB is the same as for LynA.

