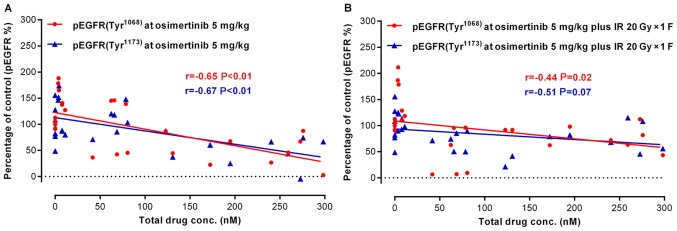
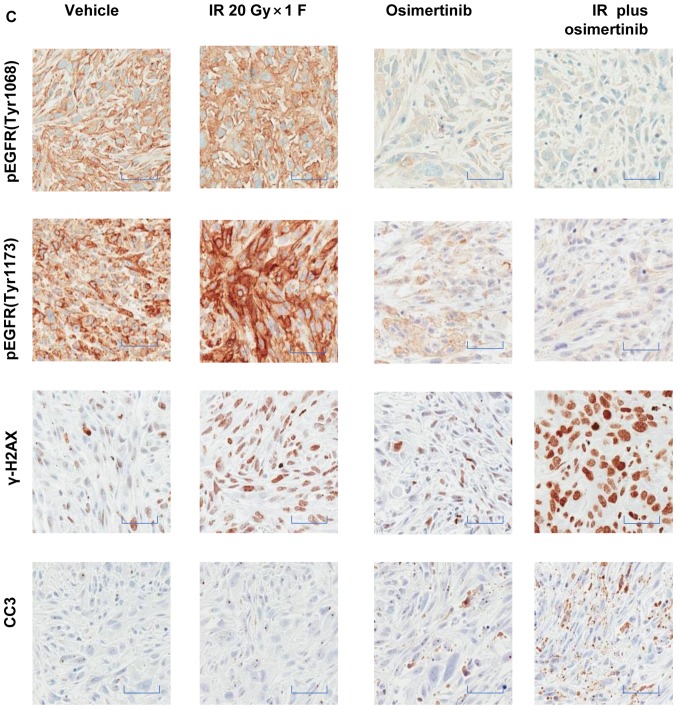
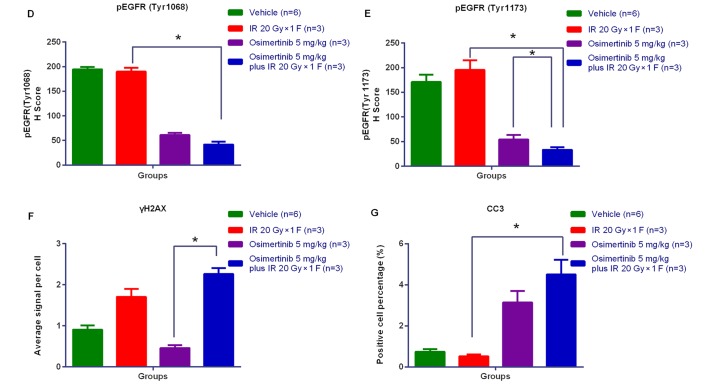
Figure 6.
Association between drug metabolism and pharmacokinetics in the NCI-H1975 ×enograft model. (A and B) The association between osimertinib concentration in plasma and p-EGFR (Tyr1068)/p-EGFR (Tyr1173) levels in tumor tissues, for (A) osimertinib alone or (B) in combination with IR. (C) The representative immunohistochemical images of p-EGFR (Tyr1068), p-EGFR (Tyr1173), γH2AX and CC3. Scale bars, 100 µm. (D-G) Quantitative analysis of the expression levels of (D) p-EGFR (Tyr1068), (E) p-EGFR (Tyr1173), (F) γH2AX and (G) CC3, respectively. *P<0.05, as indicated. p-, phosphorylated; EGFR, epidermal growth factor receptor; γH2AX, H2A histone family member X; CC3, cleaved caspase-3.


