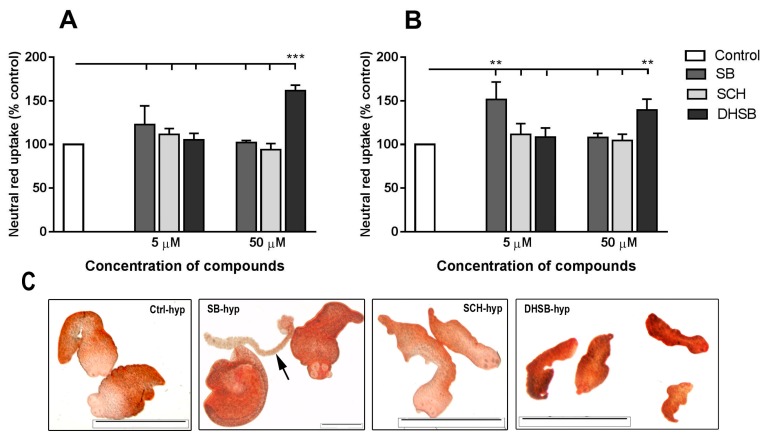
Figure 3.
Viability of larvae measured by means of neutral red uptake after 72 h of incubation under aerobic (A) and hypoxic (B) conditions with SB, SCH and DHSB (5 µM and 50 µM). Results represent means ± SD from three experiments in triplicates/group and are expressed as the proportions (%) of absorbance in treated groups relative to the absorbance in the control group (100%). Significantly different values from controls are shown as ** p < 0.01, *** p < 0.001. (C) Representative images of live larvae from hypoxic cultivation after exposure to 50 µM concentration of FLs. Note dead larva (arrow). Scale bar = 2000 µM, Ctrl (control), (SB) silybin; (SCH) silychristin; (DHSB) dehydrosilybin.

