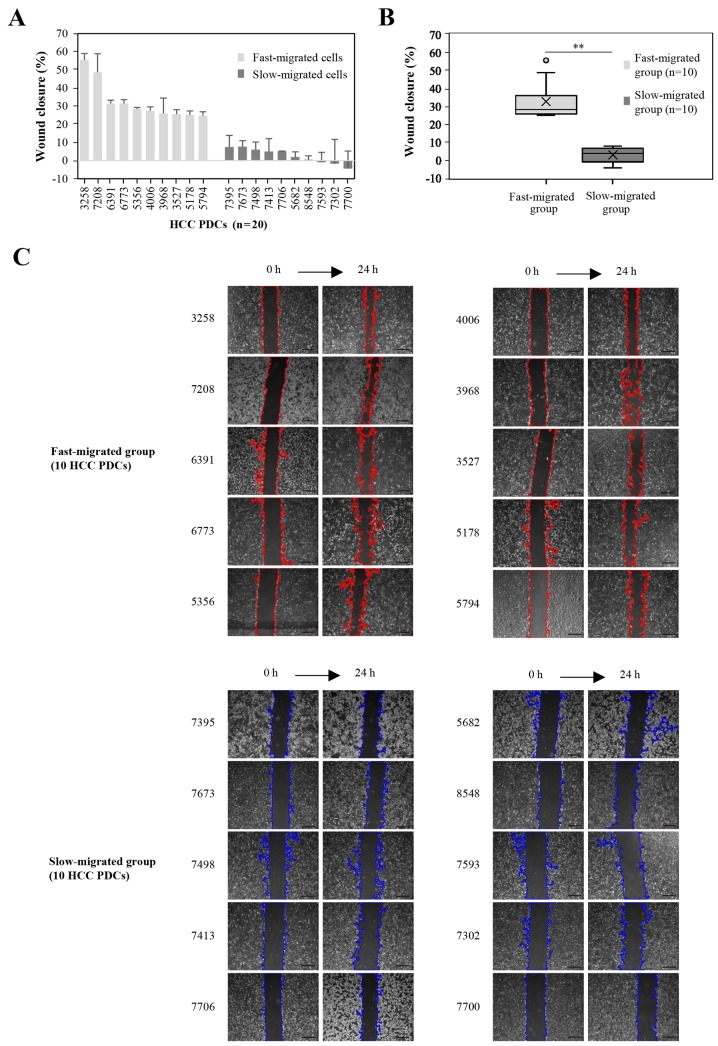
Figure 1.
Migration rate between the fast- and slow-migrated PDC groups. Among the 36 PDC samples, the wound closure percentage of the top 10 and bottom 10 PDCs according to migration rate are presented as (A) individuals and (B) groups. (C) Representative images of wound-healing assays at 0 and 24 h. Upper, top 10 PDCs in migration rate (the edges of the wound-healing scratches are marked red). Lower, bottom 10 PDCs in migration rate (the edges of wound-healing scratches are marked blue). Data represent at least three independent experiments. **P<0.01. Scale bar, 100 µm. PDCs, patient-derived cells. The numbers in (A) are representative of the different PDCs.

