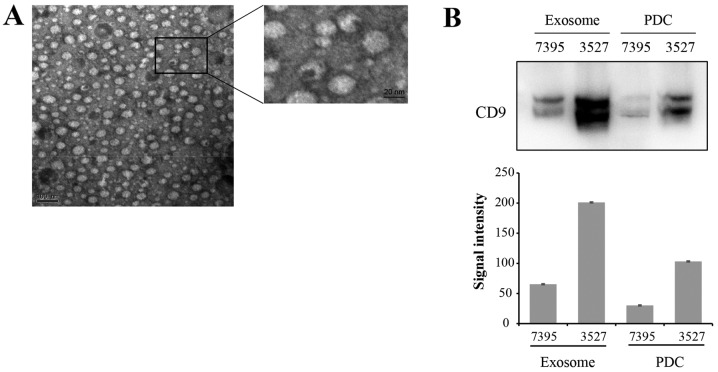
Figure 2.
Characterization of PDC-derived exosomes. (A) Representative electron micrograph of PDC-derived exosomes revealed a typical size distribution of 50–150 nm in diameter. Scale bars, 100 nm and 20 nm. (B) Western blot (upper image) and the gray signal intensities (lower image) of exosome marker CD9 in PDCs and PDC-derived exosomes were shown. PDCs, patient-derived cells.

