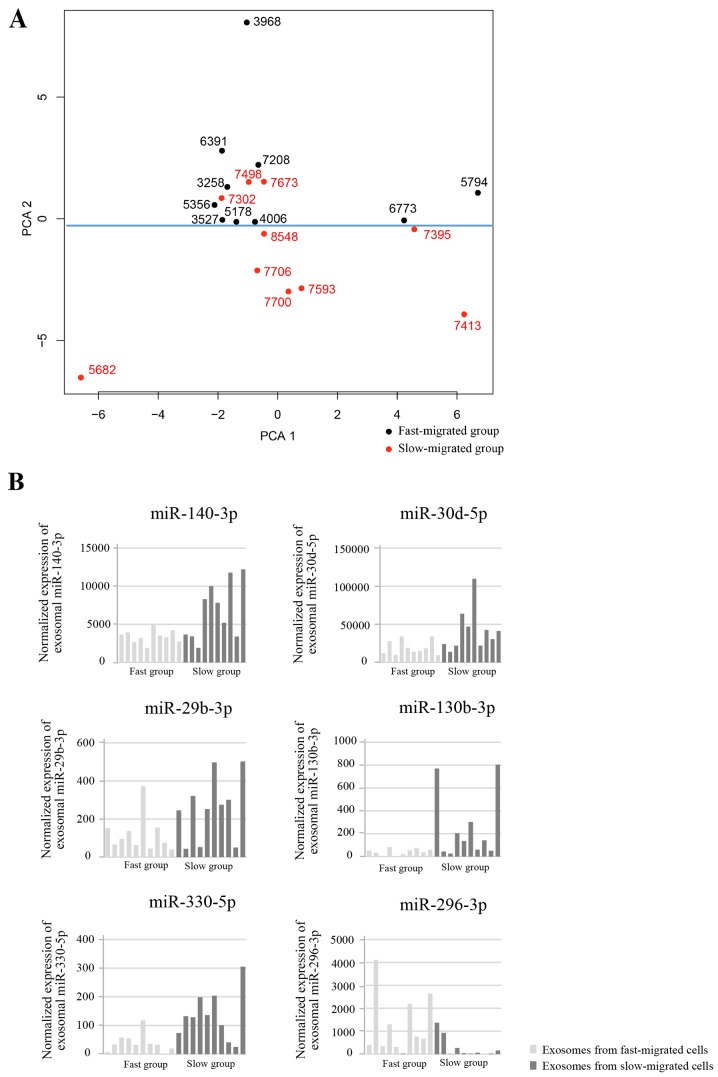
Figure 4.
Differentially expressed exosomal miRs between the fast- and slow-migrated groups. (A) Unsupervised principal component analysis clustered the samples into two groups (separated by the blue line). Ten samples with a fast migration rate and 7 out of 10 samples with a slow migration rate were naturally clustered into two groups. (B) Six exosomal miRs were differentially expressed between fast- and slow-migrated groups. In the fast-migrated group, five of them were downregulated (miR-140-3p, miR-30d-5p, miR-29b-3p, miR-130b-3p and miR-330-5p) and one (miR-296-3p) was upregulated compared with the low-migrated group. miR, microRNA.

