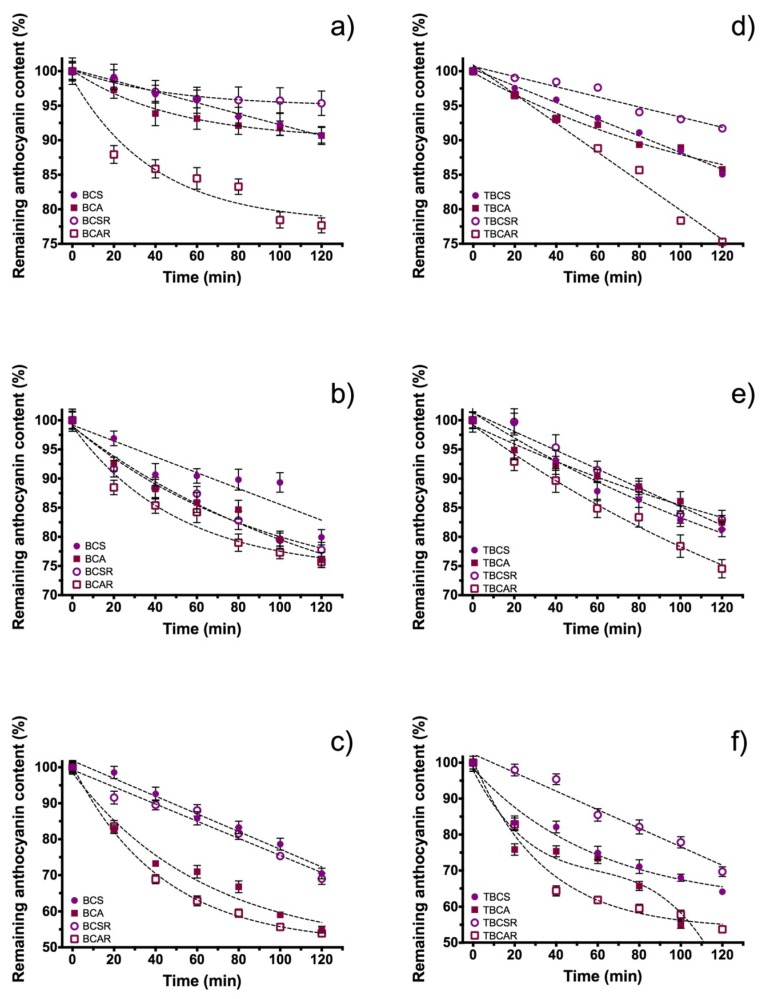
Figure 5.
Anthocyanin content as function of time at different temperatures; (a,d) at 40 °C, (b,e) at 60 °C, and (c,f) at 80 °C. Samples extracted with ethanol/citric acid (BCS) and ethanol/acetic acid (BCA), samples after resin column (BCSR and BCAR), and microencapsulated samples using TEOS (TBCS, TBCA, TBCSR, TBCAR).

