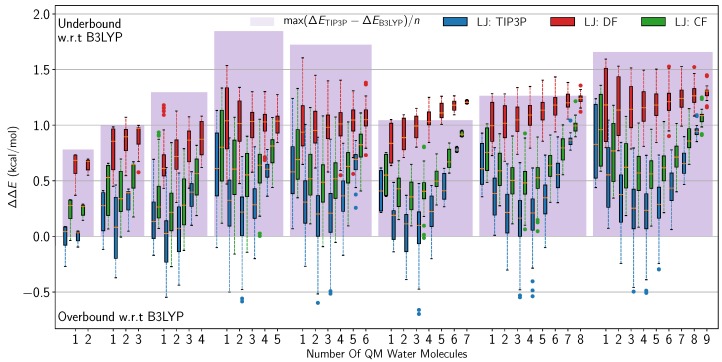
Figure 3.
Boxplot of the difference in interaction energies with respect to the pure B3LYP results. The horizontal axis is firstly divided divided into eight subsets based on the total number of molecules in each size of water cluster, and then further divided into subsets defined by how many of the total amount of molecules are in the QM subsystem. Each box represents the distribution of interaction energy differences from all possible QM/MM combinations with that number of QM molecules. The boxes spans 50% (the IQR) of the distribution of energy differences, while the whiskers represent ±1.5 IQR. The three datasets are produced using the three different sets of LJ parameters: The original TIP3P parameters (blue), the dimer fit (DF) parameters (red), and the cluster fit (CF) parameters (green). The blue patches behind the box plots show the maximum difference between the two pure descriptions.

