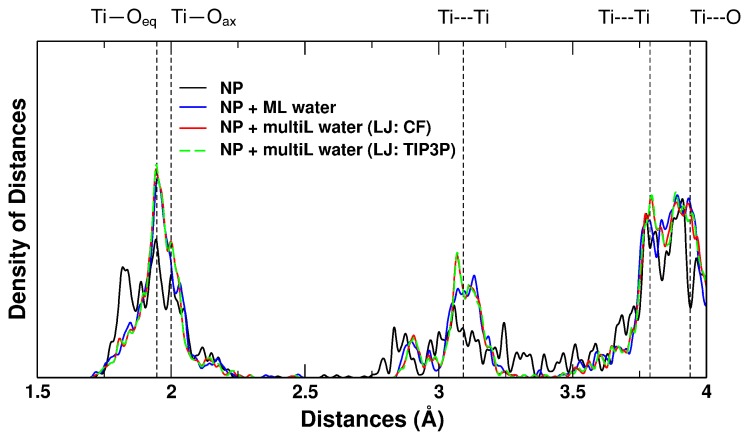
Figure 5.
Distances-distribution (simulated EXAFS) computed with B3LYP for the bare NP (black), the NP with the adsorbed water monolayer (ML, blue), computed with QM/MM for the NP with the water multilayer using the CF LJ (multiL, red) and using the TIP3P LJ (multiL, dashed green). Dashed black lines correspond to the anatase bulk Ti—O, Ti---Ti and T---O distances.

