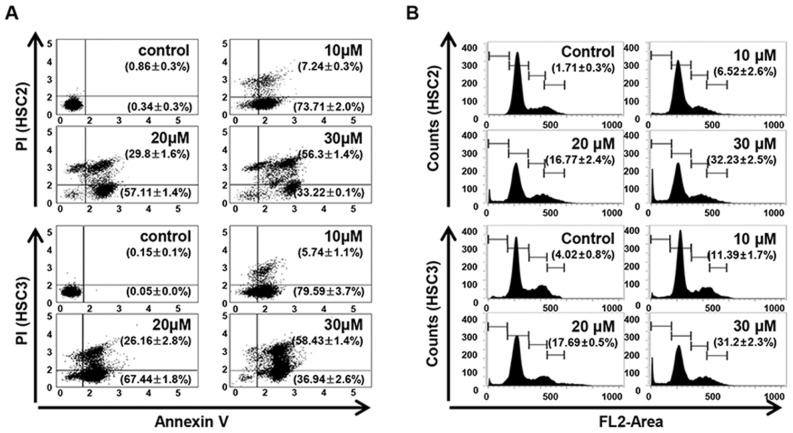
Figure 2.
Effect of licochalcone H treatment on apoptosis in oral squamous cell carcinoma. (A) Cells with Annexin V/PI double staining were examined using a fluorescence-activated cell sorter. The graphs are representative of triplicate experiments, and the percentages of Annexin V-positive (lower-right quadrant) and Annexin V/PI double-positive (upper-right quadrant) are shown in the relevant quadrants. (B) Cell death analysis using PI staining and flow cytometry. The graph represents the proportion of Sub-G1 peak phase (apoptotic) cells. PI, propidium iodide.

