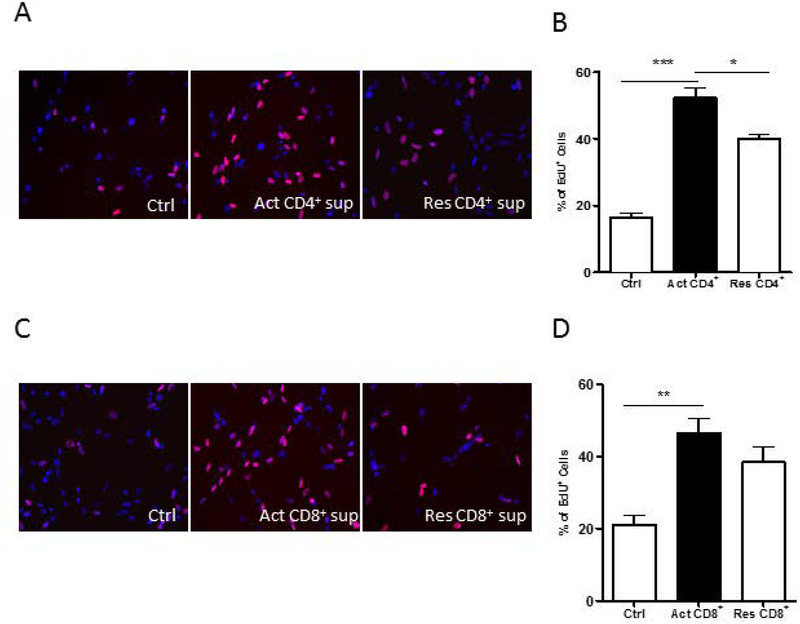
Figure 2: Effect of CD4 and C8 lymphocytes on OPC proliferation.
(A) Representative photomicrographs of OPCs exposed to T cell media control (Ctrl), activated (Act) CD4+ cell sups or resting (Res) CD4+ cell sups. Nuclei are stained blue with DAPI and EdU+ cells are red. (B) Act -CD4+ cell sups induced increased proliferation of OPCs as determined by percentage of EdU positive cells. (C) Representative photomicrographs of OPCs exposed to Ctrl, Act CD8+ cell sup or Res CD4+ cell sup. Nuclei are stained blue with DAPI and EdU+ cells are red. (D) Act -CD8+ cell sups induced increased proliferation of the OPCs. Data represent mean + SEM of three independent experiments. N=3 for Band D, *P<0.05; **P<0.005 and ***P<0.0005

