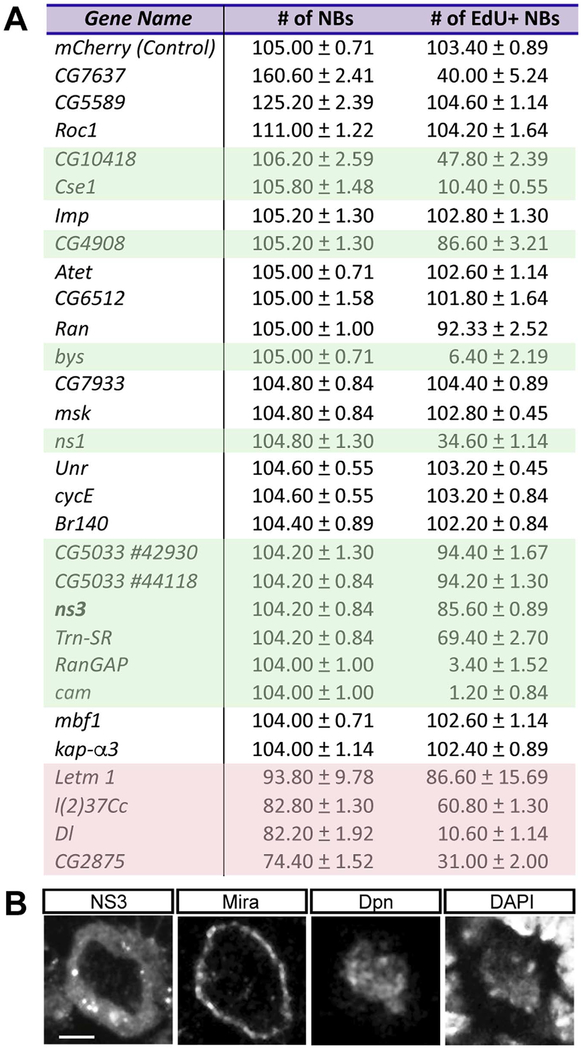
Fig. 1.
RNAi screen identifies candidate genes to promote NB proliferation. (A) The 28 NB-enriched genes assayed for RNAi phenotypes. The number of total NBs and EdU+ NBs in the L3 brain were quantified for each RNAi gene knockdown. Green shading indicates RNAi lines where no significant change in NB number (p > 0.05) but a decrease in EdU+ NBs (p < 0.05) indicating premature NB cell cycle exit. Red shading indicates RNAi lines that lead to a reduction in total NB number, due to NB death or differentiation. n = 5 brain lobes from 5 larvae for each gene. Genotype: UAS-Dcr-2; wor-gal4; UAS‐mCD8:GFP/UAS‐gene RNAi. (B) A representative neuroblast in the L3 brain. wor-gal4 was used to drive expression of UAS‐ns3:YFP (FBst0050769). The neuroblast was stained with membrane marker Mira, NB marker Dpn, and DNA marker DAPI. Scale bar: 5 μm. Genotype: wor‐gal4/UAS‐ns3:YFP.

