FIGURE 6.

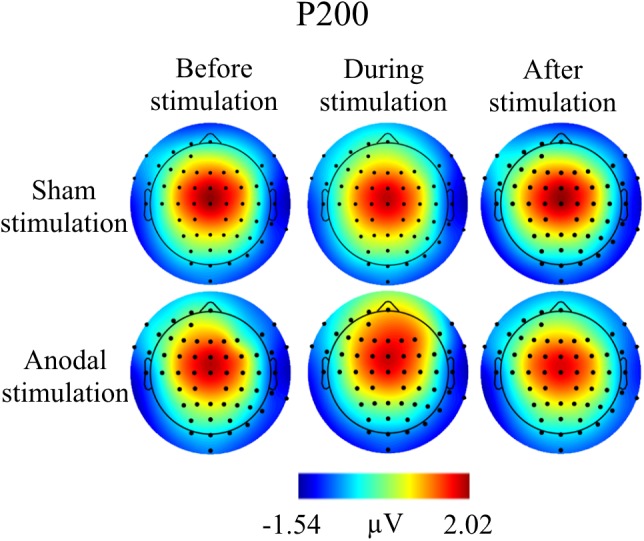
Topographies for grand average AEP of an interval 125–190 ms for P200 auditory component, separately for the different conditions. The peak interval was identified by grand average AEP.

Topographies for grand average AEP of an interval 125–190 ms for P200 auditory component, separately for the different conditions. The peak interval was identified by grand average AEP.