FIGURE 2.
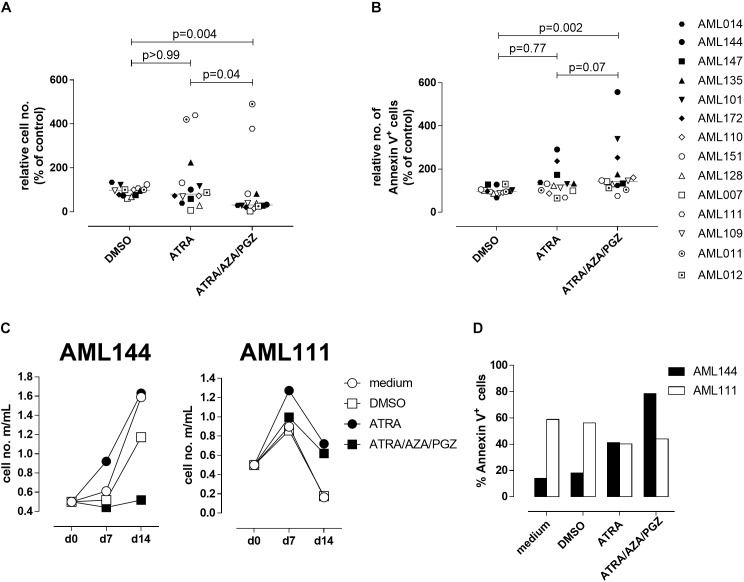
Cell growth and apoptosis of primary AML blasts. (A,B) Primary AML blasts (5 × 10⁵) were incubated in AIM-V medium supplemented with 10% HS, G-CSF and SCF (each 50 ng/mL) and as indicated with medium, DMSO, ATRA, or ATRA/AZA/PGZ. On 14 of treatment, cell numbers were measured by conventional trypan blue staining. (A) Shows cell numbers normalized to medium (n = 14 per group), (B) shows Annexin positive cells normalized to medium (medium = 100%; n = 14 per group). Symbols represent individual patient samples and horizontal bars mark median values. Statistical analysis for group differences were performed using Friedman and Dunn’s multiple comparisons test. (C) Primary AML blasts (5 × 10⁵) of patient sample AML144 (left panel) or AML111 (right panel) were incubated as described in (A). On days 7 and 14 of treatment, cell numbers were measured by conventional trypan blue staining. (D) AML blasts as described in (A) were characterized by Annexin V binding 14 days after treatment. Shown are % Annexin positive cells of AML111 (white bars) and AML144 (black bars).

