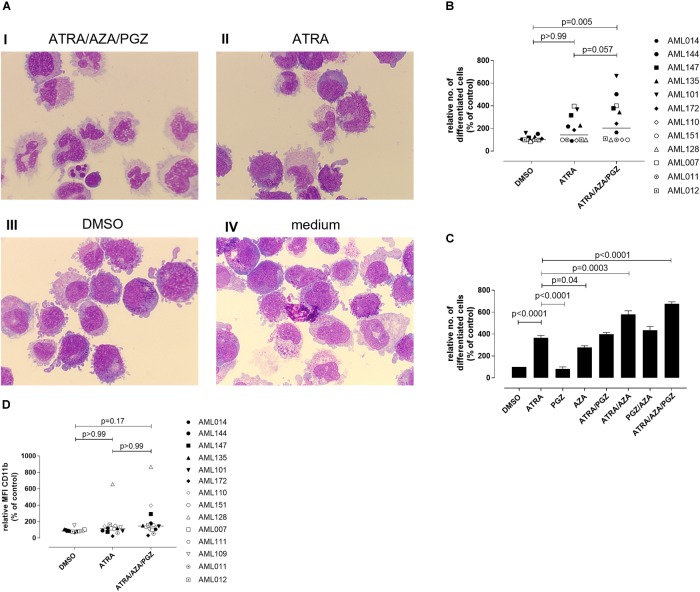
FIGURE 3.
Morphological differentiation of primary AML blasts. (A) Primary AML blasts (5 × 10⁵) were treated as described in Figure 2. On day 14 after start of treatment, cells (5 × 10⁴) were analyzed by light microscopy after centrifugation on microscope slides and May-Grünwald and Giemsa staining. Shown are AML cells of sample AML101 after treatment with ATRA/AZA/PGZ (I), ATRA (II), DMSO (III), or medium (IV), respectively. (B) Summary of 12 primary AML patient’s samples on day 14 of treatment as described in (A). Cells with morphological signs of differentiation were normalized to medium controls. Symbols represent individual patient samples and horizontal bars mark median values. (C) On day 14 of treatment with ATRA, PGZ, AZA, ATRA/AZA, ATRA/PGZ, PGZ/AZA, ATRA/AZA/PGZ, or DMSO sample AML101 was analyzed for morphological changes as described in (A). Cells with morphological signs of differentiation were normalized to medium controls. Data represent means of morphological changes from two independent experiments. Error bars indicate the standard deviation. (D) Primary AML samples (n = 14) at day 14 of treatment. Shown are the relative MFIs of CD11b staining normalized to medium. Symbols represent individual patient samples and horizontal bars mark median values. Statistical analysis for group differences were performed using Friedman and Dunn’s multiple comparisons test.

