FIGURE 4.
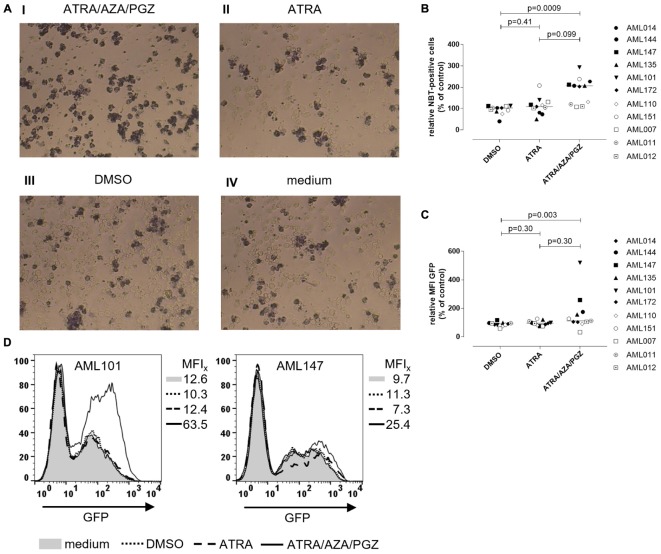
Reactive oxygen species production and phagocytosis of AML blasts. (A) Primary AML blasts were treated as described in Figure 2. On day 14 of treatment, 5 × 10⁵ AML blasts were incubated with NBT (1 mg/mL) and PMA (200 ng/mL) for 90 min. Subsequently, cells were centrifuged on microscope slides for light microscopy. Shown are AML blasts of sample AML101 after treatment with ATRA/AZA/PGZ (I), ATRA (II), DMSO (III), or medium (IV), respectively. (B) Summary of primary AML samples (n = 11) on day 14 days of treatment as described in (A). NBT positive cells were counted in a blinded fashion and were normalized to medium. Symbols represent individual patient samples and horizontal bars mark median values. Statistical analysis for group differences were performed using Friedman and Dunn’s multiple comparisons test. (C,D) Primary AML blasts were treated as described in Figure 2. On day 14 of treatment, 2.5 × 10⁵ AML blasts (n = 11 patients) were incubated with 6.25 × 10⁶ GFP-labeled E. coli bacteria for 10 min. Subsequently, cells were analyzed by flow cytometry for GFP positive cells. (C) Summary of data (n = 11 AML samples) representing MFIs of GFP signal normalized to medium controls. Symbols represent individual patient samples and horizontal bars mark median values. Statistical analysis for group differences were performed using Friedman and Dunn’s multiple comparisons test. (D) Individual overlay plots and MFI of GFP signals measured with AML101 and AML147.

