FIGURE 4.
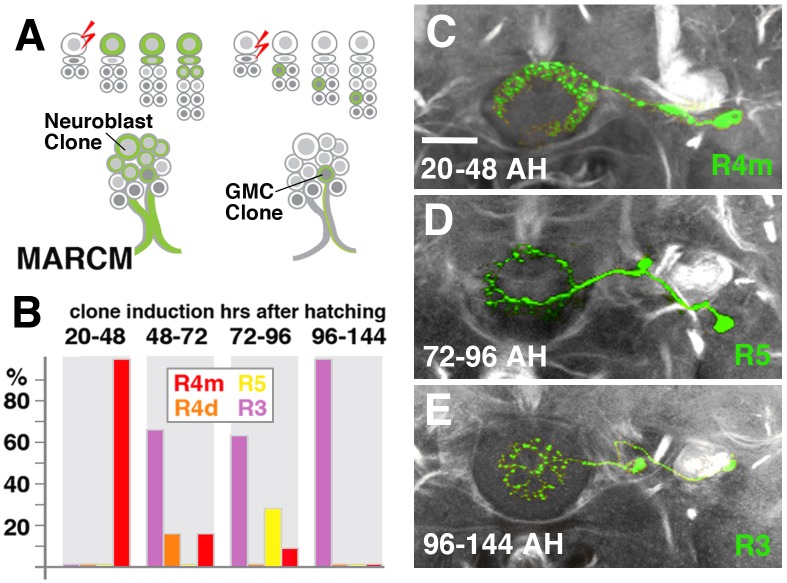
R-neuron subclasses represent sublineages of DALv2. (A) Schematized overview of MARCM clone induction and resultant clone categories. Neuroblast clones result in labeling of the entire lineage from induction onward; ganglion mother cell (GMC) clones result in singly-labeled neurons. (B) Histogram of single cell clone R-neuron subclasses generated by temperature shifts during distinct time windows throughout larval development. A total of 33 single cell clones were generated, % reflect the proportion of clones of a given subclass generated during a given time window. (C–E) Representative clones (green) from three time windows after hatching (AH). Axon tracts labeled by anti-Neuroglian (gray). (C) R4m. (D) R5. (E) R3. Scale bars represent 25 μm (C–E).

