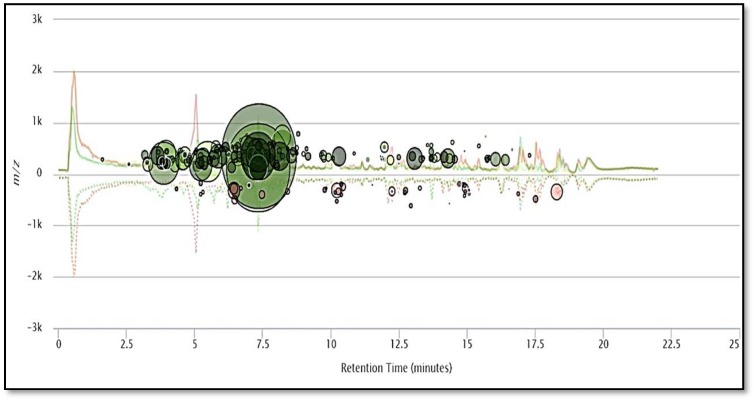
Figure 4.
The metabolomic cloud map generated after paired untargeted metabolomics, showing the up- and- down regulated metabolites between blue and Manchurian ashes. The metabolic cloud map revealed a total of 247 metabolite features (p < 0.01) between blue and Manchurian ashes. The green circles represent upregulated metabolite features in Manchurian ash, whereas brown circles represent down regulated metabolite feature in blue ash. The cloud map was generated using XCMS bioinformatics platform for metabolomics.

