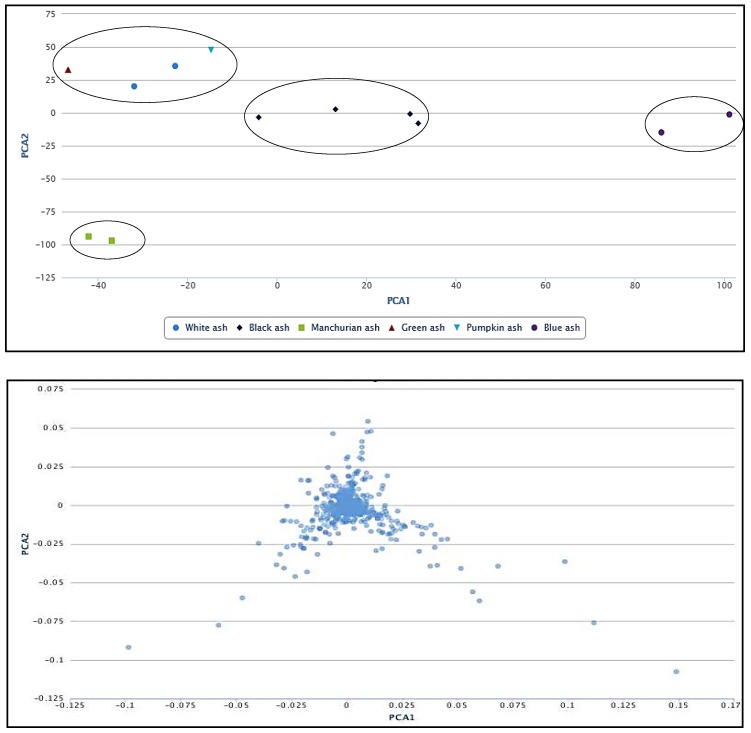
Figure 6.
Principal component analysis (PCA; top panel), indicating the correlations between white, black, Manchurian, green, pumpkin and blue ashes. Loading plot (bottom panel) implying the relationship between the metabolite features that relate to the sample grouping. PCA and loading plots were generated using XCMS bioinformatics platform for metabolomics. Four clusters were observed on the PCA plot. Green, white and pumpkin ashes were clustered in section, Meliodes. Two clusters were observed for the section Fraxinus (referred as Fraxinus a and b), occupied by black and Manchurian ashes. Blue ash was clustered in a section, Dipetelae.

