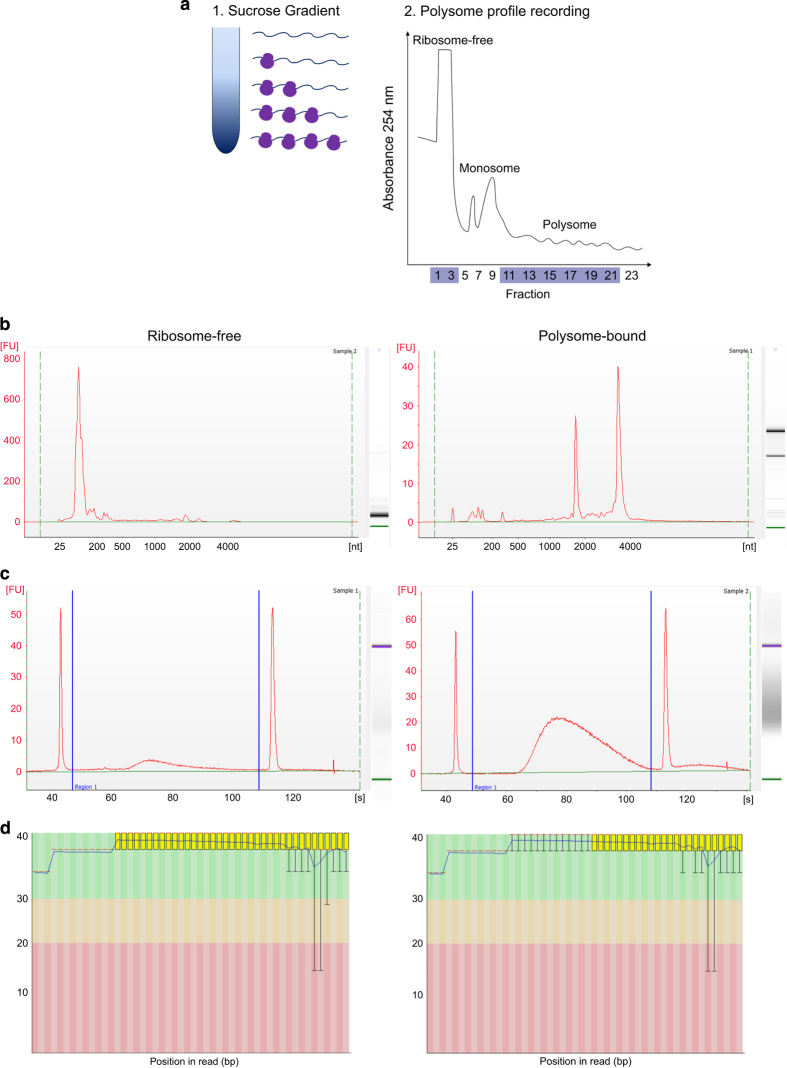
Figure 3. Polysome profiling followed by RNA-seq during cardiomyogenic differentiation.
(a) Schematic representation of the sucrose gradient used to segregate ribosome-free and ribosome-bound RNAs and representative polysome profile (hESCs - D0 replicate 2) recorded at 254 nm. Ribosome-free and polysome fractions are indicated. (b-d) Representative quality analysis of ribosome-free and polysome-bound samples. (a) RNA quality analysis using Agilent 2100 Bioanalyzer. (b) cDNA library quality analysis using Agilent 2100 Bioanalyzer. (c) RNA-sequencing reads quality analysis using FastQC. All representative images correspond to D0 hESC sample, replicate 2.

