Figure 1.
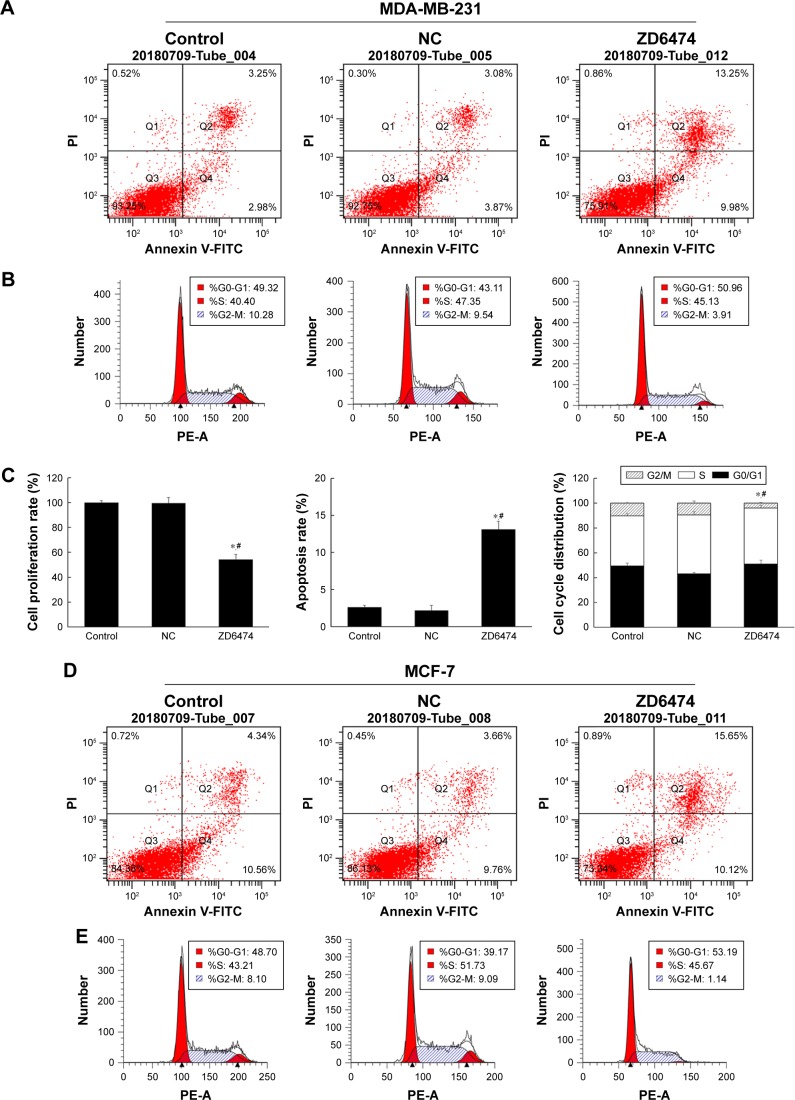
Vandetanib induced growth inhibition, apoptosis, and cell cycle arrest.
Notes: (A) MDA-MB-231 apoptosis under vandetanib treatment was measured by flow cytometry with Annexin V/PI staining. (B) MDA-MB-231 cell cycle analysis upon vandetanib treatment by flow cytometry with PI staining. (C) MDA-MB-231 growth inhibition, quantification of apoptosis and quantification of cell cycle induced by vandetanib. (D) MCF-7 apoptosis under vandetanib treatment was measured by flow cytometry with Annexin V/PI staining. (E) MCF-7 cell cycle analysis upon vandetanib treatment by flow cytometry with PI staining. (F) MCF-7 growth inhibition, quantification of apoptosis, and quantification of cell cycle induced by vandetanib. *P<0.05 (compared with control) or #P<0.05 (compared with NC) was considered significant.
Abbreviations: NC, negative control; PI, propidium iodide.


