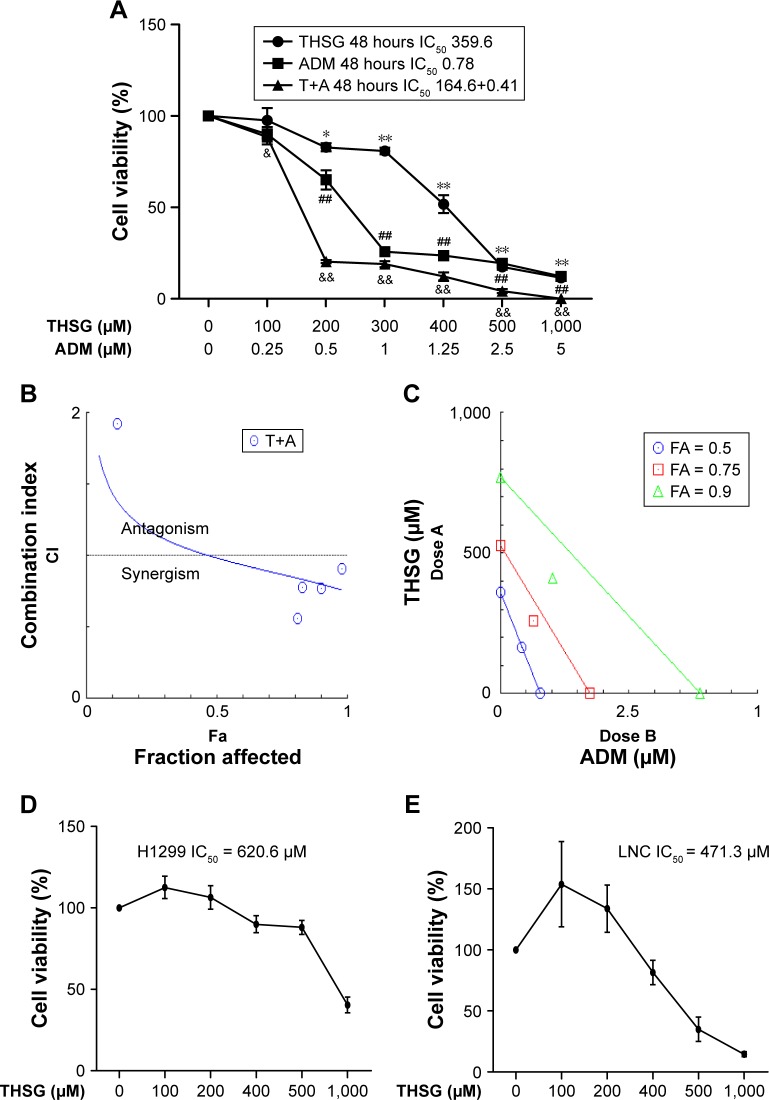
Figure 1.
The proliferative inhibition assay of THSG, ADM, and THSG in combination with ADM on different cell lines.
Notes: Cells were exposed to various concentrations of THSG and ADM alone or in combination at 400:1 molar ratio for 48 hours. (A) Cell viability curves were plotted based on the MTT assay in MCF-7 cell lines. The synergistic effects between drugs were shown as CI-Fa plot (B); isobologram (C) was calculated with the Calcusyn™ software. (B) CI values are represented by points above (indicate antagonism) or below the lines (indicate synergism). (C) Isobologram analysis represents the individual doses of drugs in the achievement of 90% growth inhibition (Fa = 0.9), 75% growth inhibition (Fa = 0.75), and 50% growth inhibition (Fa = 0.5). (D) Cell viability of THSG was performed based on the MTT assay in H1299 cell lines. (E) Cell viability of THSG was performed based on the MTT assay in LNC cell lines. *P<0.05, **P<0.01 vs the Ctr group with THSG; ##P<0.01 vs the Ctr group with ADM; &P<0.05, &&P<0.01 vs the Ctr group with THSG.
Abbreviations: ADM, Adriamycin; CI, combination index; Ctr, control; T+A, THSG + Adriamycin; THSG, 2,3,5,4′-Tetrahydroxystilbene-2-O-β-d-glucoside.

