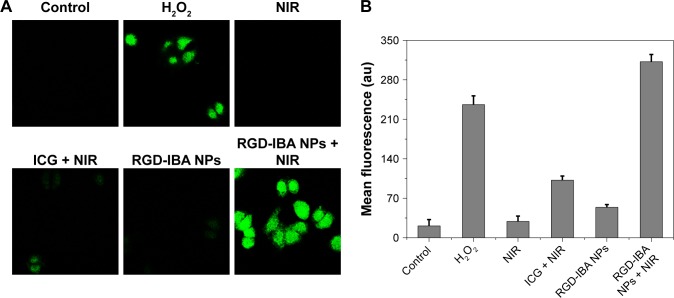
Figure 6.
In vitro ROS detection.
Notes: (A) The fluorescence images of KB cells after different treatments as indicated. Green was the fluorescence signal of ROS indicator DCFH-DA. Scale bar =60 µm. (B) Quantification of induced ROS intensity achieved by flow cytometry.
Abbreviations: ART, artemisinin; DCFH-DA, dichlorofluorescein diacetate; ICG, indocyanine green; NIR, near infrared; NPs, nanoparticles; RGD, arginine-glycine-aspartic acid; ROS, reactive oxygen species.

