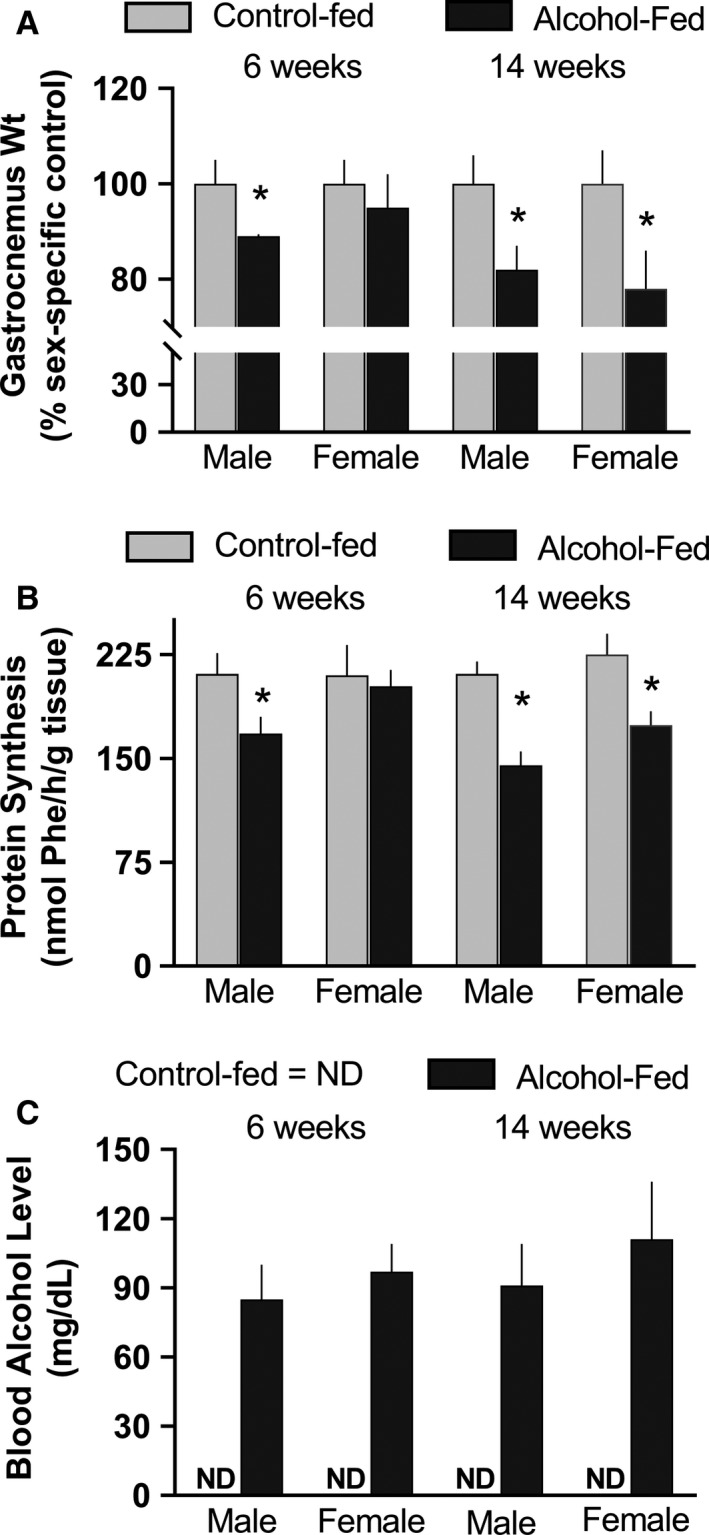
Figure 3.

Muscle protein weight and synthesis in alcohol‐fed and control‐fed male and female rats after 6 and 14 weeks of feeding. Values are means ± SEM; n = 9–11 for each group for each male and female rat. Panels A and B, *P < 0.05 compared to time‐matched value from male rats. Panel C, blood alcohol level (BAL) in control‐fed and alcohol‐fed mice; ND = not detectable. There was no statistical difference between BAL values between groups. For gastrocnemius weight and protein synthesis, differences between male and female rats at a given time point were compared using a pooled Student's t‐test.
