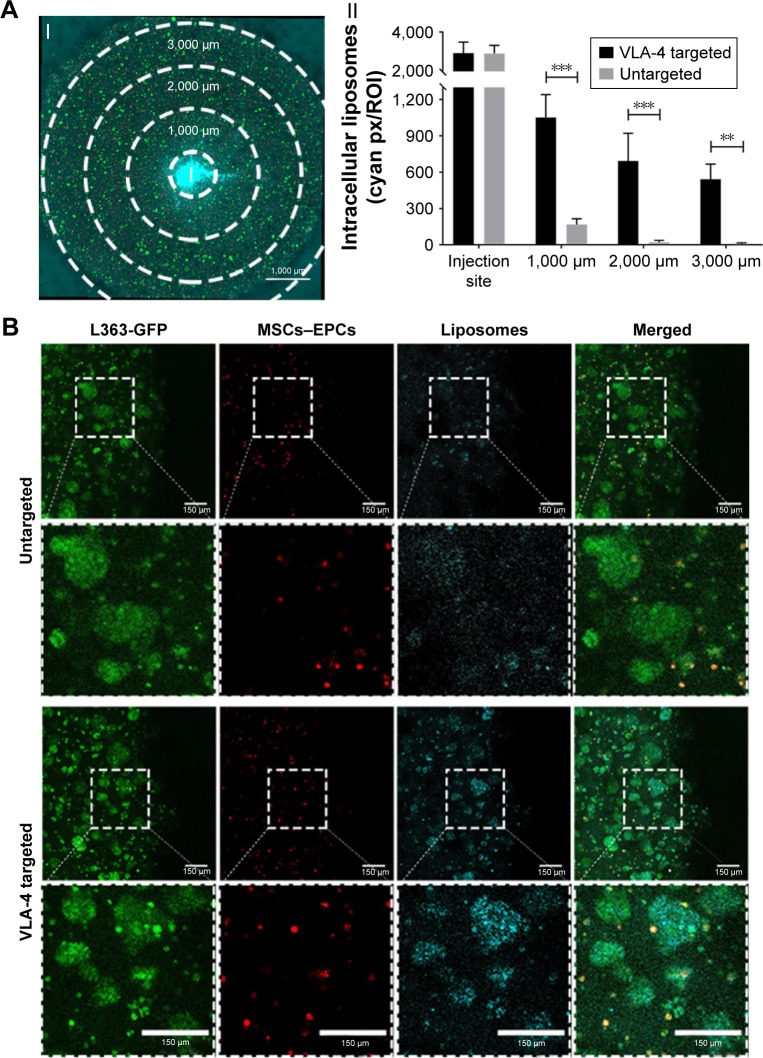
Figure 5.
Enhanced liposomal uptake in myeloma cell clusters when using VLA-4 targeted liposomes.
Notes: (A) I. Confocal microscopy overview picture showing the regions that were quantified in each culture, I = insertion site. The scale bar represents 1,000 µm. II. Quantification of intracellular liposomes (~110 nm), in all regions, for both untargeted and VLA-4 targeted liposomes, 48 hours after insertion. All cultures were washed extensively before quantification, to remove all noninternalized liposomes. Data are presented as mean ± SD. **P<0.01, ***P<0.001. (B) Confocal images at the border of the plug, showing L363 cells (GFP, green), MSCs, and EPCs (DiD, red) and intracellular liposomes (rhodamine, cyan). The scale bars represent 150 µm.
Abbreviations: EPCs, endothelial progenitor cells; MSCs, mesenchymal stromal cells; VLA-4, very late antigen-4.

