Figure 6.
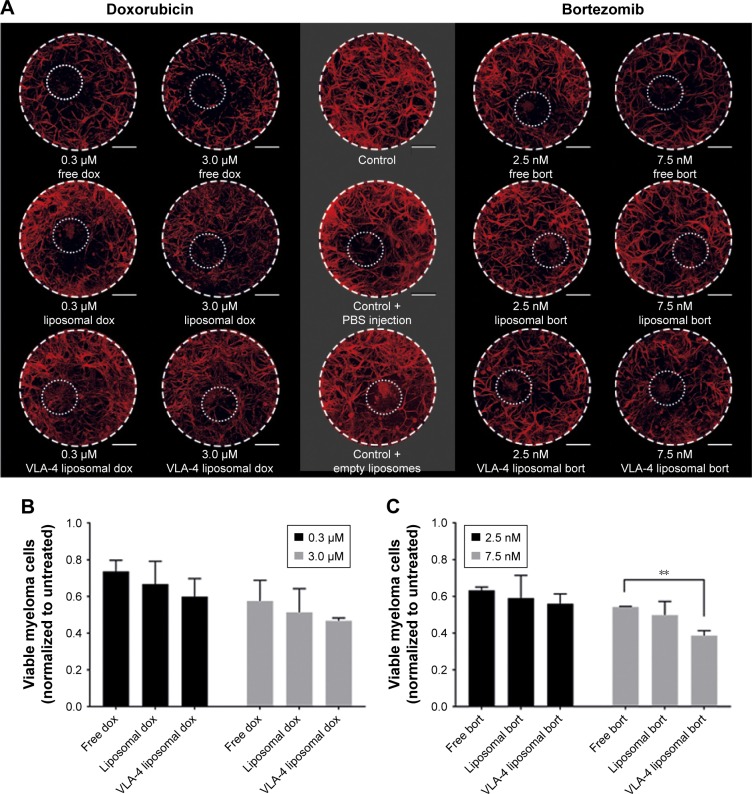
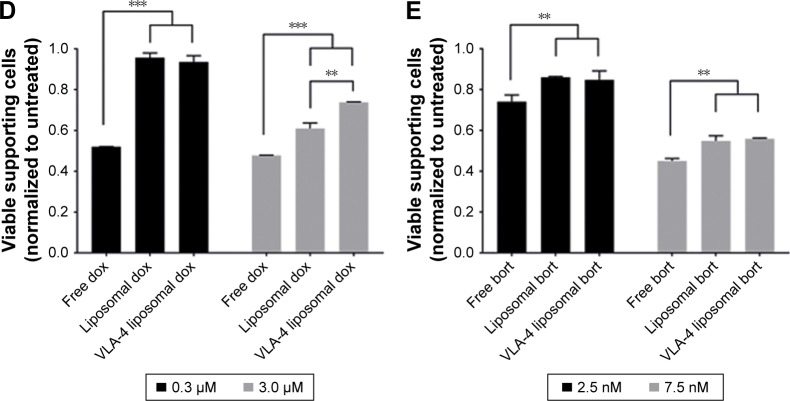
Free and liposomal chemotherapy tested in the 3D myeloma–BM model.
Notes: (A) Confocal overview pictures showing 3D cocultures 48 hours after treatment. MSCs, EPCs, and myeloma cells were visualized staining f-actin (phalloidin, red). The border of each plug is indicated by a white dashed circle. The insertion site of each culture is indicated by a dotted white circle. The scale bars represent 1,000 µm. Cultures were treated with doxorubicin (six left images) or bortezomib (six right images) both with free drug, untargeted liposomes, and VLA-4 targeted liposomes (both ~75 nm). Controls were taken along with no treatments or sham treatments (PBS or empty liposomes). (B) Quantification of viable myeloma cells, 48 hours after doxorubicin treatment and (C) bortezomib treatment. (D) Quantification of viable supporting cells, 48 hours after doxorubicin treatment and (E) bortezomib treatment. Data are presented as mean ± SD (n=3). **P<0.01, ***P<0.001.
Abbreviations: EPCs, endothelial progenitor cells; MSCs, mesenchymal stromal cells; VLA-4, very late antigen-4.


