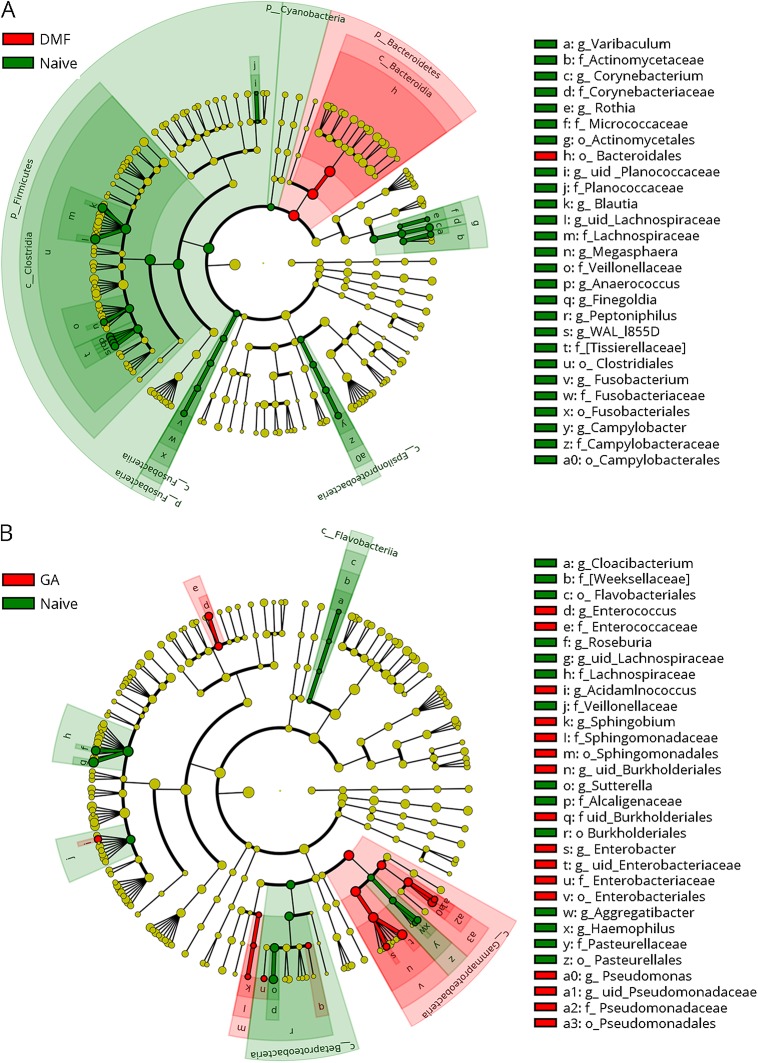
Figure 3. Cladogram indicating the effect of disease-modifying therapies on the phylogenetic structure of MS patients' microbiota.
Upper: DMF vs Naive. Lower: GA vs Naive. Only significant taxa (p-value < 0.05, LDA score >2) identified by LEfSe were displayed. Differential abundant taxa are marked by colored shades: red indicates enrichment in the therapy groups (DMF or GA), and green indicates enrichment in the naive group. Circles represent phylogenetic levels from kingdom to genus from inside out. Each dot represents a taxon and its diameter is proportional to the taxon's effect size. c = class; DMF = dimethyl fumarate; f = family; g = genus; GA = glatiramer acetate; k = kingdom; LEfSe = linear discriminant analysis effect size; LDA = linear discriminant analysis; o = order; p = phylum; uid = unidentified, according to the GreenGenes database.

