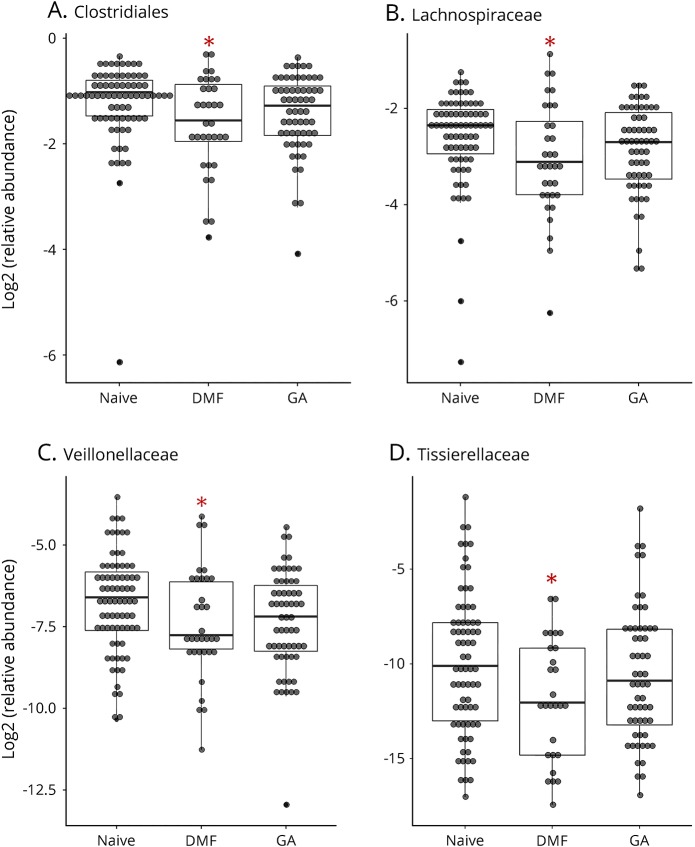
Figure 4. Relative abundances of the order Clostridiales and its family members are differentially changed by therapy.
Relative abundances of the order Clostridiales (A) and its family members are differentially changed by therapies (B: Lachnospiraceae; C: Veillonellaceae; D: Tissierellaceare). Asterisk (*) indicates significant change compared with naive as determined by the LEfSe analysis (see also in table 2). The inner bisecting line indicates the median. The lower and upper edges of the box represent the 25th and the 75th percentiles, respectively. LEfSe = linear discriminant analysis effect size.

