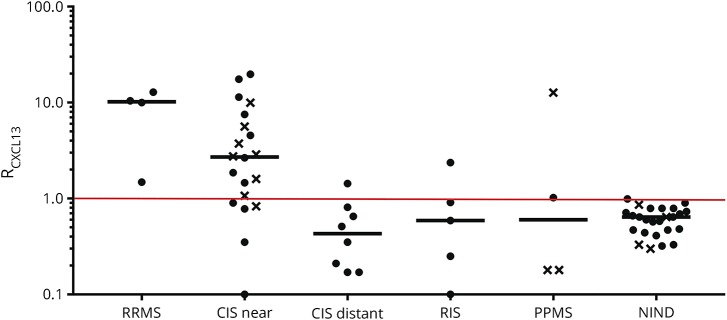
Figure 2. CXCL13 in inflammatory demyelinating diseases (IDDs).
CXCL13 values are expressed as RCXCL13, defined by the ratio of ICXCL13 (circle) or CCXCL13 (x) of the patient to the mean + 2 SD of ICXCL13 or CCXCL13 of NIND controls. Since the distribution of values for ICXCL13 and CCXCL13 in controls was normal, values above 1 were considered significantly elevated above NIND controls. Median RCXCL13 values are shown as a bar. The RCXCL13 calculation was utilized so that the data from complete CSF/serum analyses generating ICXCL13 values could be shown using the same y-axis as CSF analyses generating CCXCL13 values. Patient groups were abbreviated as in the legend to figure 1. CIS = clinically isolated syndrome; NIND = noninflammatory neurologic diseases; PPMS = primary progressive MS; RIS = radiologically isolated syndrome; RRMS = relapsing-remitting MS.

