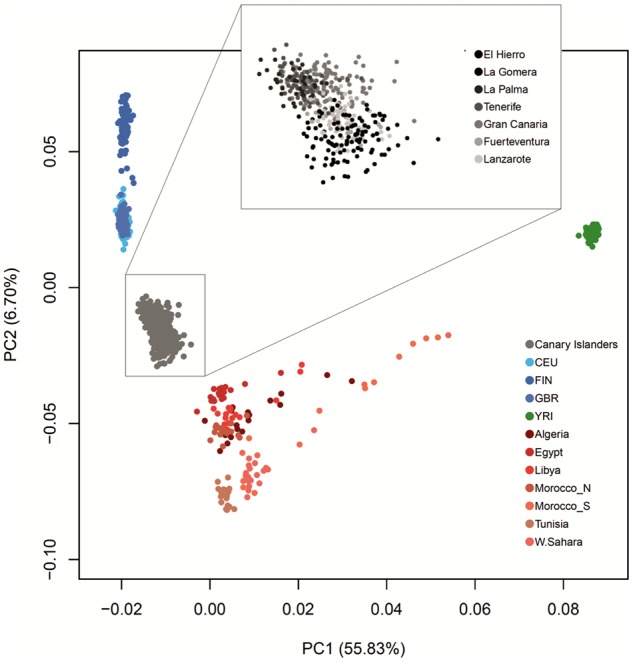
Fig. 1.

Plot of the first two principal components (explaining 62.5% of variability) from PCA of Canary Islanders and samples from reference populations from Europe, North Africa, and sub-Saharan Africa. The inset depicts a detailed view per island. Results are based on a subsample of 100,175 SNPs excluding those in high LD (pairwise r2 threshold = 0.5).
