Fig. 5.

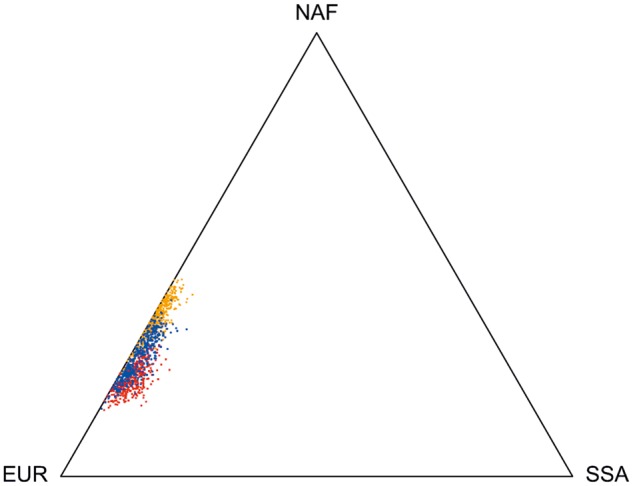
Triangle plot of individual genomic admixture proportions in Canary Islanders as estimated by ADMIXTURE with K = 4 (red), ELAI (blue), and LAMP-LD (orange).

Triangle plot of individual genomic admixture proportions in Canary Islanders as estimated by ADMIXTURE with K = 4 (red), ELAI (blue), and LAMP-LD (orange).